Heat Mitigation
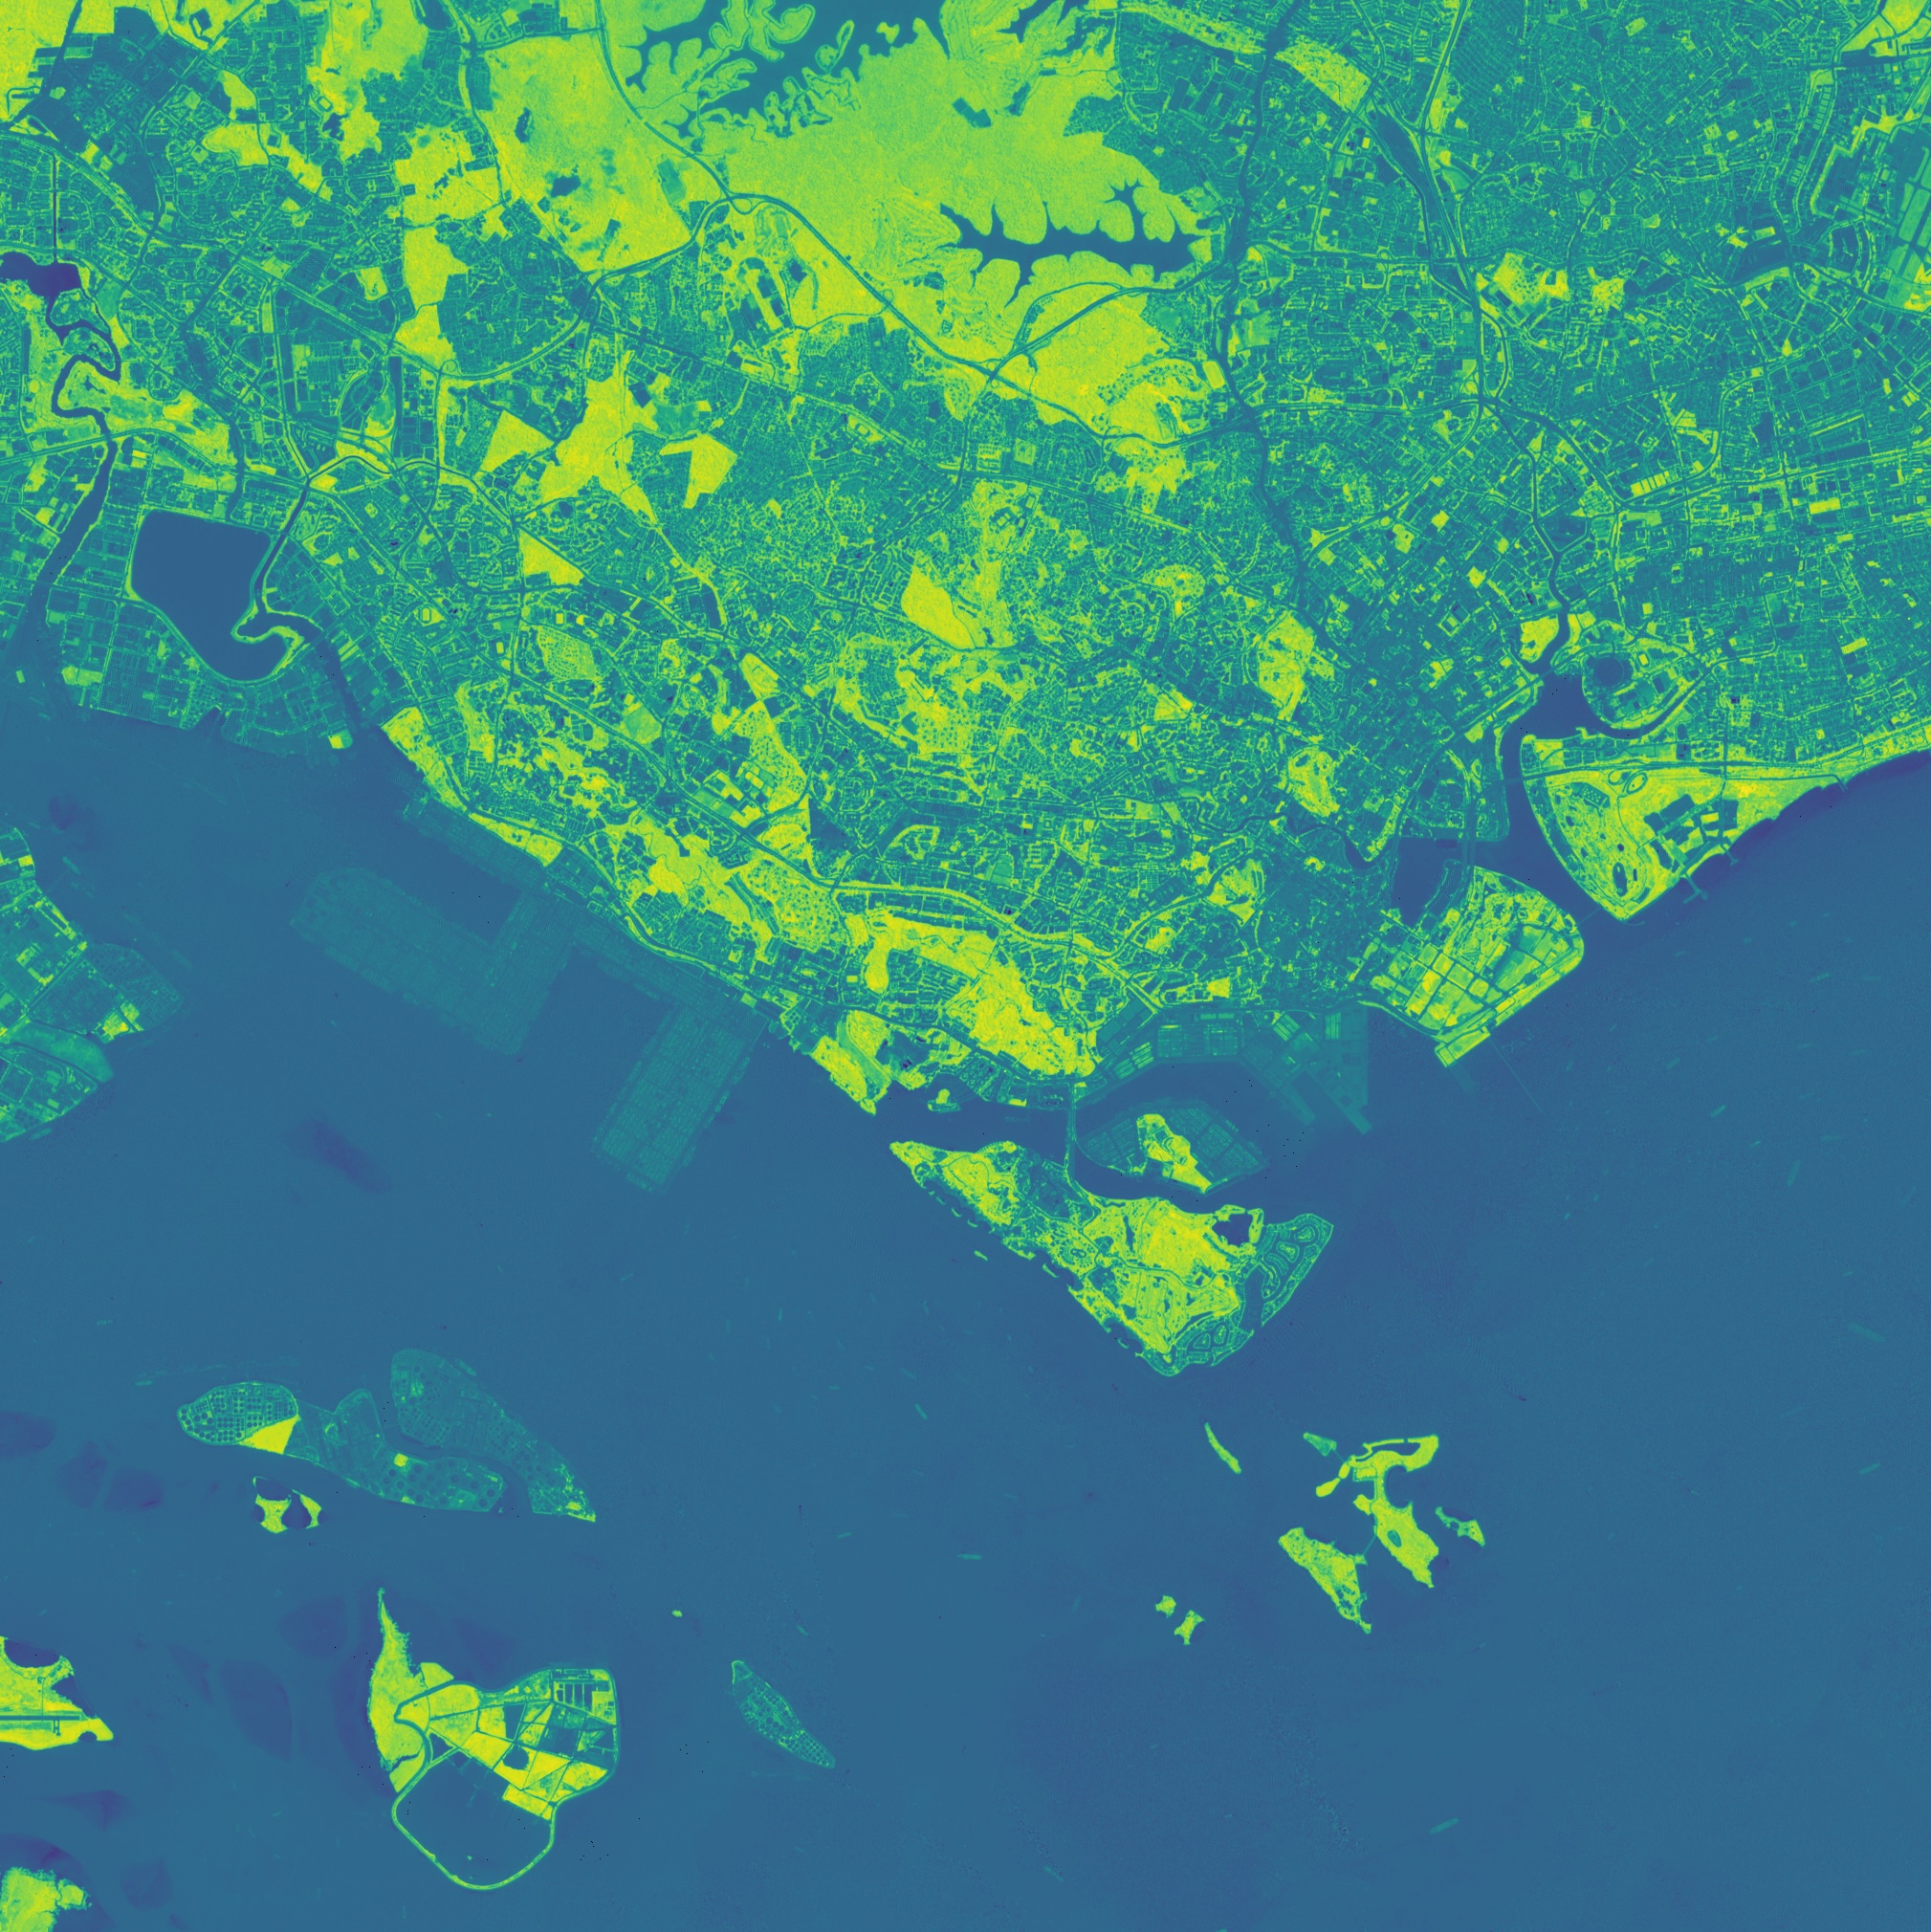
Thermal imagery pinpoints urban heat hotspots to guide green infrastructure and material choices, reducing surface temperatures and enhancing overall comfort.
Thermal imagery pinpoints urban heat hotspots to guide green infrastructure and material choices, reducing surface temperatures and enhancing overall comfort.
How does it work?
Cities often struggle to accurately identify localized heat islands, leading to inefficient mitigation efforts and persistent high temperatures. High-resolution thermal imagery provides precise surface temperature maps, enabling planners to target green infrastructure, reflective materials, and other interventions where they will have the greatest impact.
High-resolution thermal imagery detects surface temperature variations at street and building scales. This precision ensures critical hotspots are accurately identified for targeted mitigation measures.
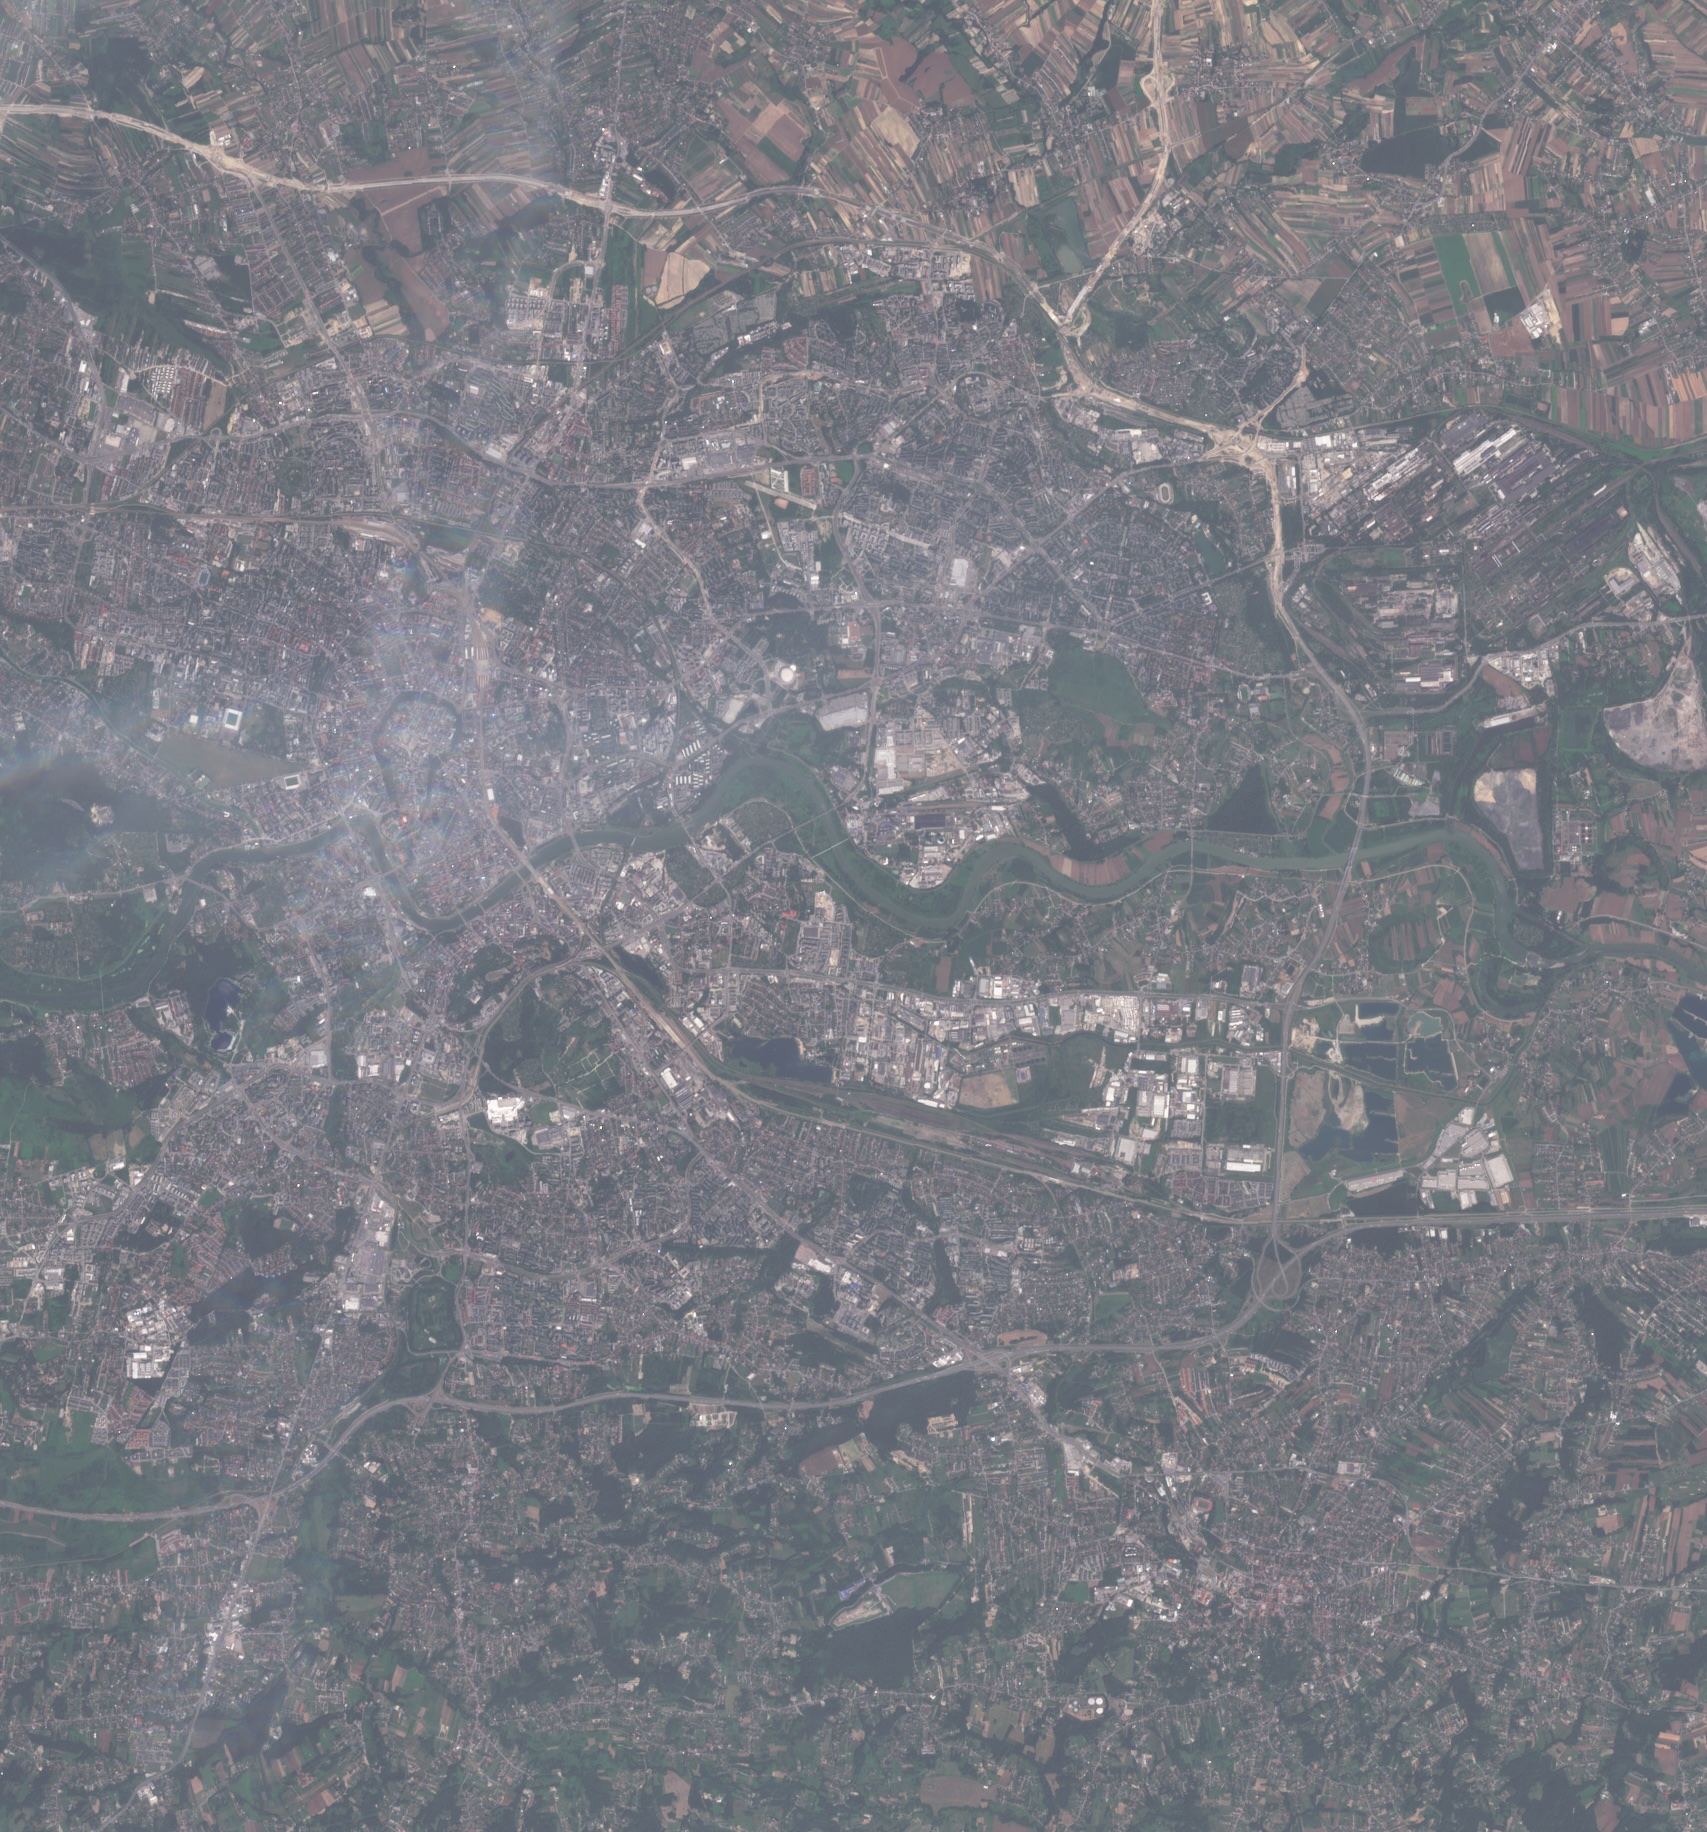
Thermal maps reveal zones where trees, green roofs, and parks yield maximum cooling effect. Targeting greenery to the hottest areas amplifies cooling and maximizes return on investment.
Surface temperature data guides selection of high-albedo pavements and reflective building materials. Applying appropriate materials where heat absorption is highest lowers surface temperatures and maintenance costs.
Mitigation strategies informed by thermal data reduce building cooling loads in targeted districts. Cities report up to 10% lower energy consumption in optimized zones, cutting costs and emissions.
Lowering surface temperatures directly improves pedestrian thermal comfort and reduces heat-related health risks. Strategic interventions can decrease local heat index, creating safer, more walkable environments.
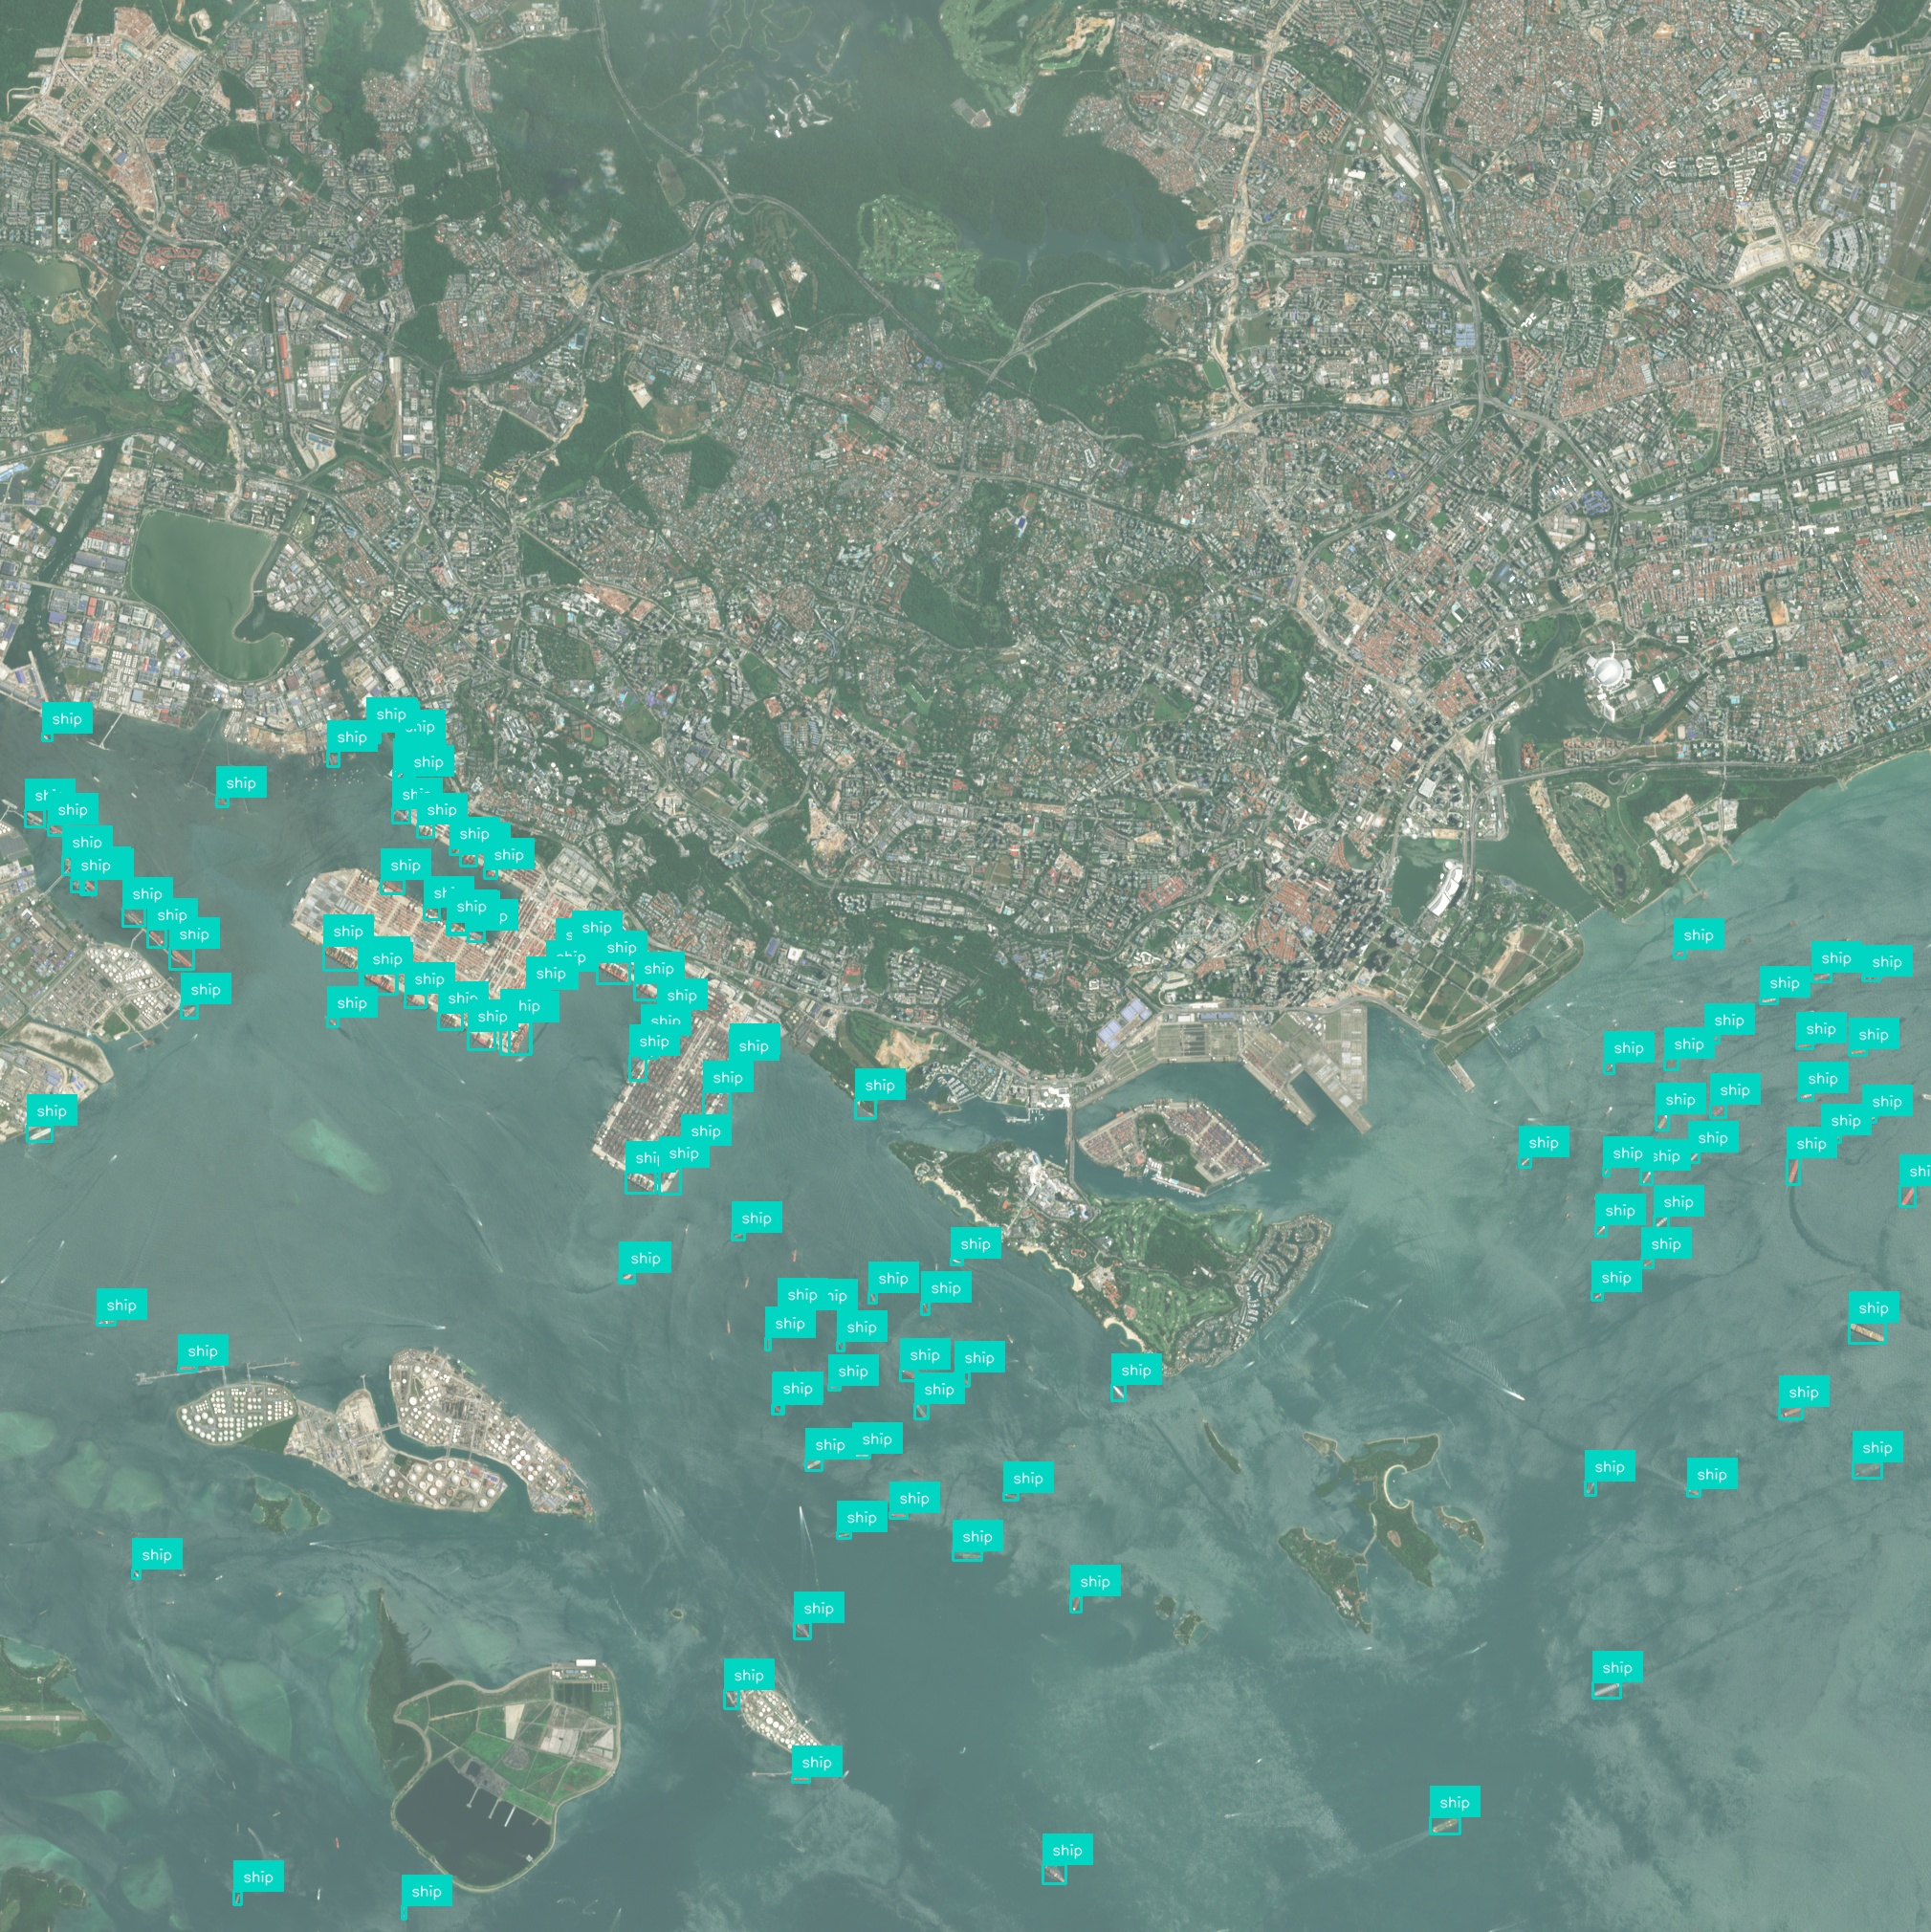
Automated processing handles entire city districts or multiple neighborhoods in a single analysis. This scalability supports regular monitoring, comparative studies, and long-term urban planning initiatives.
Have a different question and can’t find the answer you’re looking for? Reach out to our support team by sending us an email and we’ll get back to you as soon as we can.
Geospatial AI Platform
AI & foundation models
Deep-learning and foundation models turn raw imagery into ready-to-use insights, so you ship answers instead of training pipelines.
Conversational workflow
Ask questions in plain language and the platform responds with charts, visualizations, and next step suggestions.
GPU-accelerated cloud
Cloud-native architecture spins up on-demand GPU clusters that scale from a single scene to global archives—no manual ops, no bottlenecks.
Any sensor, any format
Optical, SAR, drone, IoT, vector or raster—ingest, fuse, and analyze without conversion headaches.
Insight you can see
Real-time 2D / 3D maps and export-ready plots make results clear for engineers, execs, and clients alike.
Turn satellite, drone, and sensor data into clear, real-time insights using powerful AI – no complex setup, just answers you can see and act on.