City Heat & Green
High-resolution satellite and drone imagery analyze urban green cover and surface temperatures to pinpoint heat islands, guiding sustainable city planning.
High-resolution satellite and drone imagery analyze urban green cover and surface temperatures to pinpoint heat islands, guiding sustainable city planning.
How does it work?
Urban planners and public health officials lack accurate, up-to-date maps of green cover and urban heat islands, limiting targeted cooling strategies and green space investments. AI-driven geospatial analysis of multi-temporal satellite and drone data provides scalable, high-resolution environmental-quality maps, enabling effective mitigation and urban resilience planning.
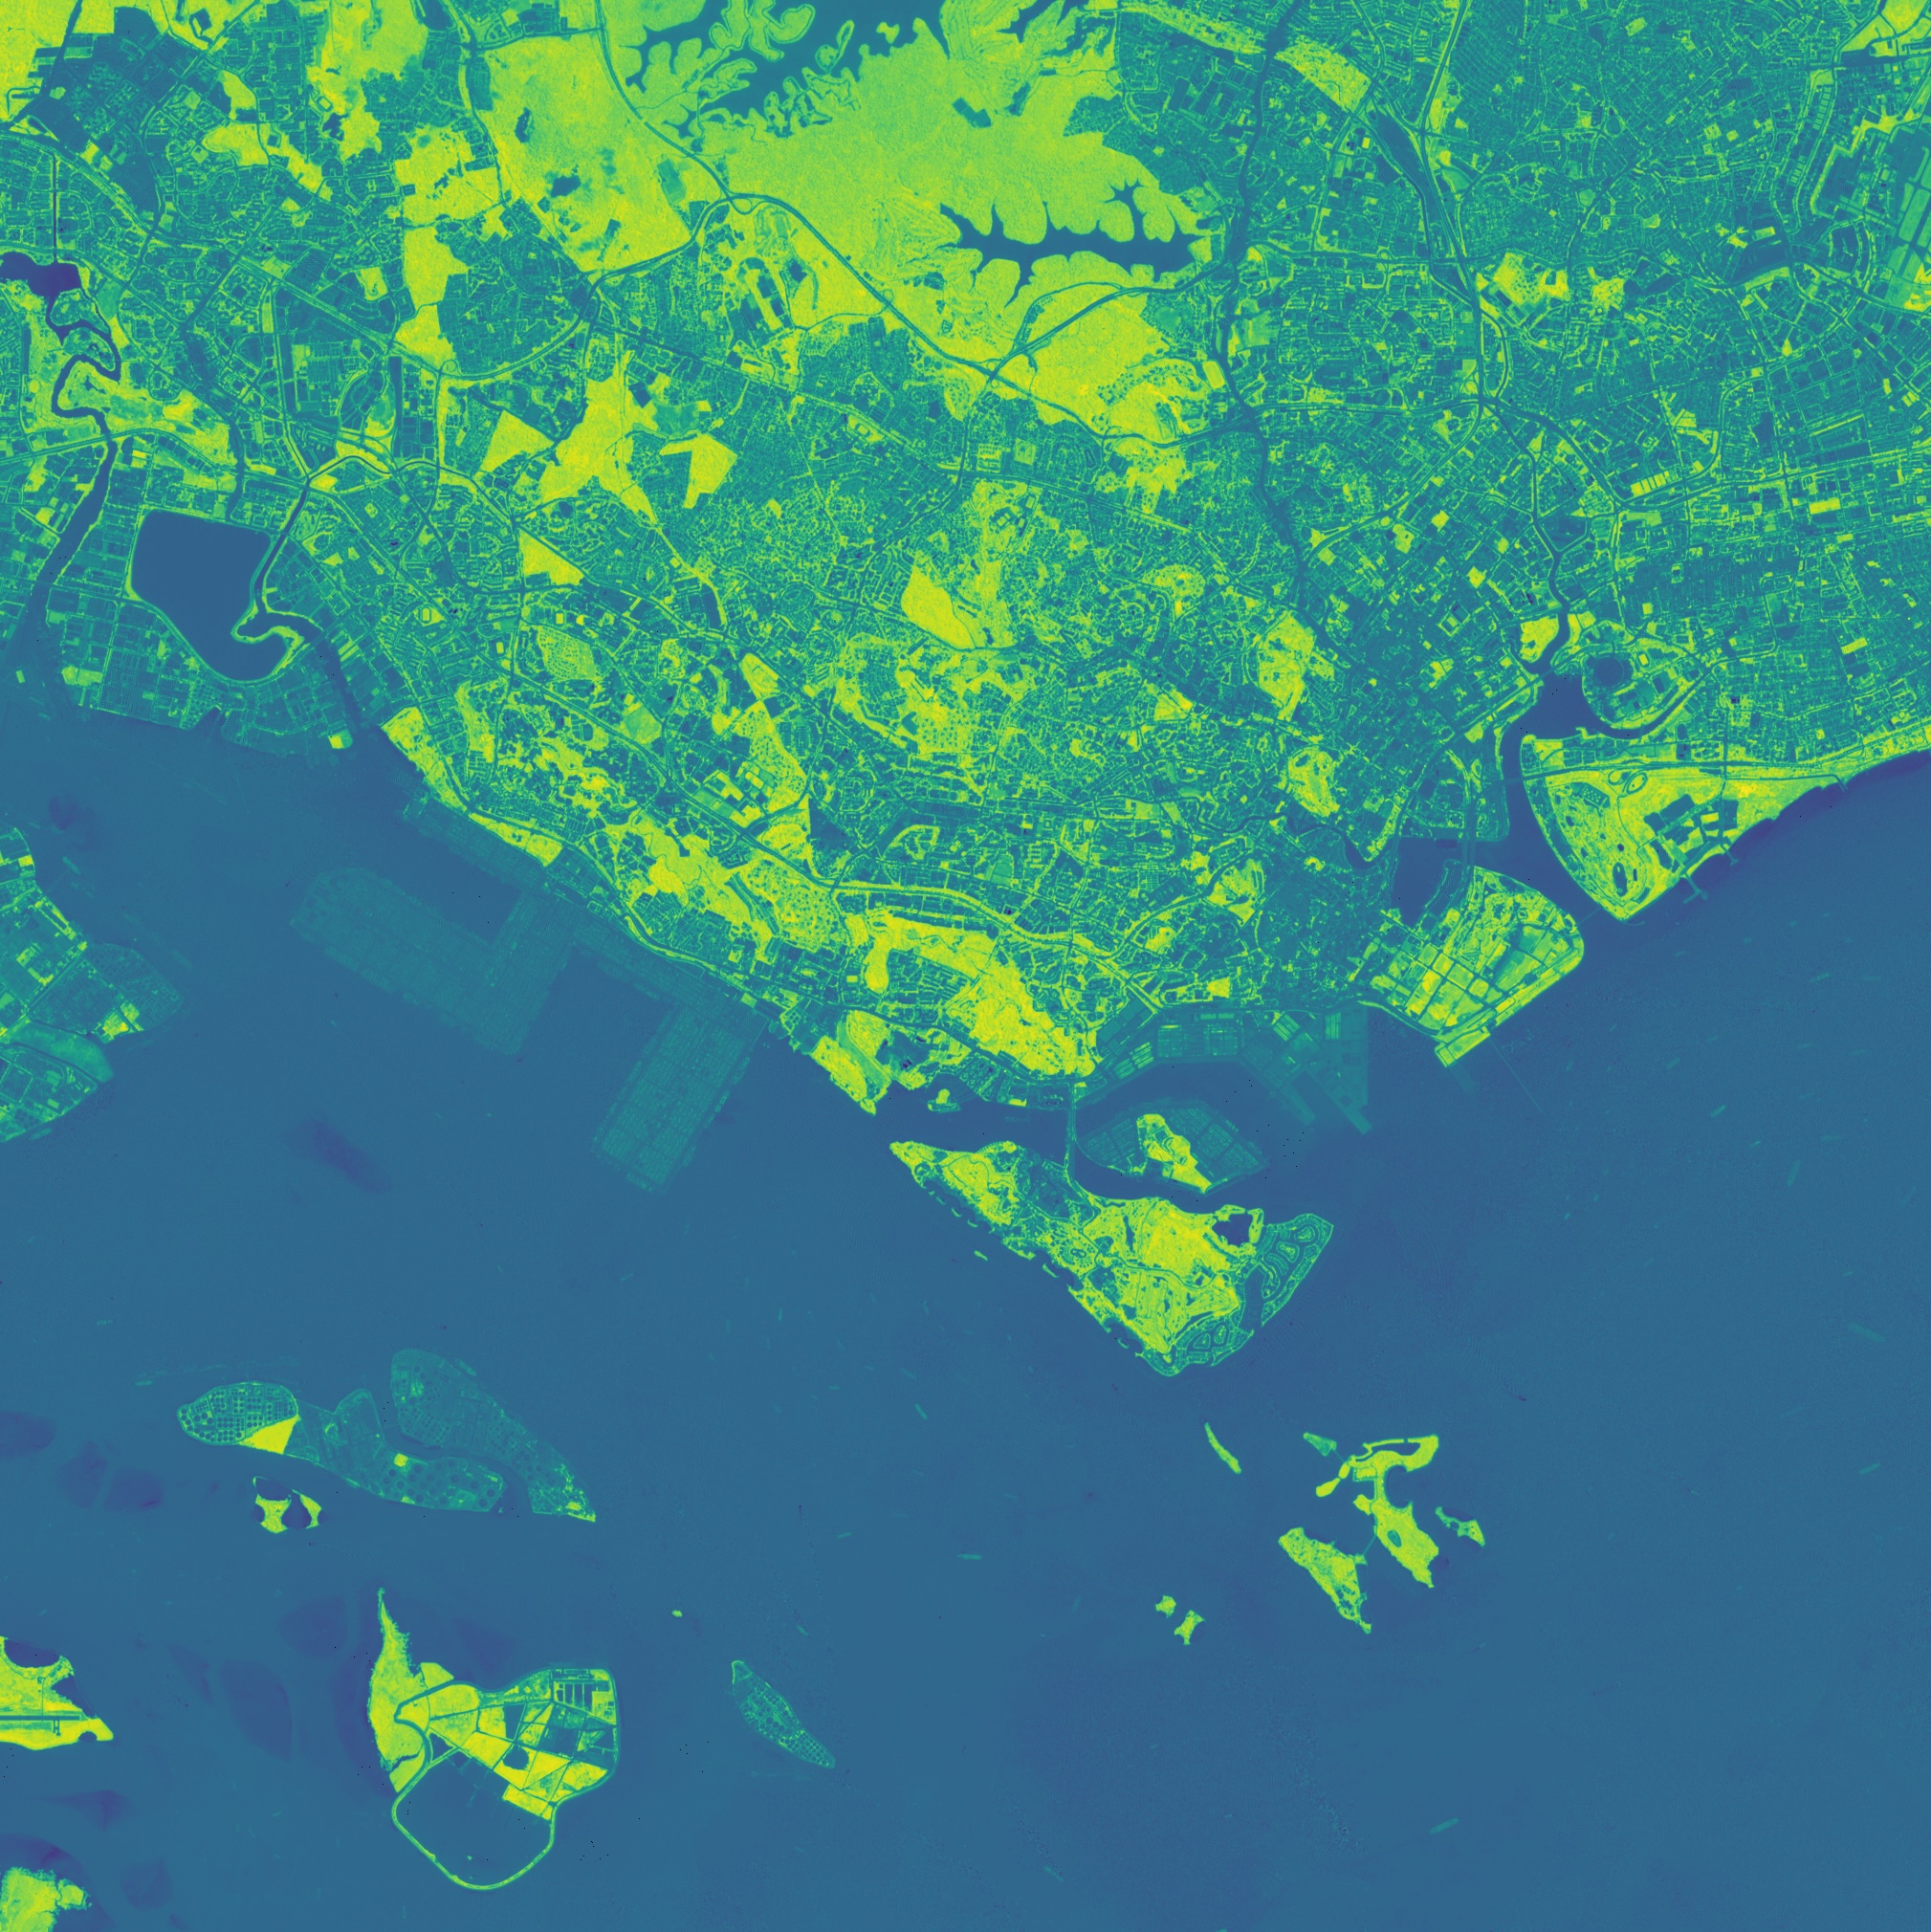
The platform classifies vegetation types and canopy density at sub-meter resolution using AI-driven image segmentation. This delivers precise green cover metrics for fine-grained urban forestry and park management.
Surface temperature anomalies are identified with thermal band analysis, highlighting urban heat island hotspots. This supports targeted cooling measures like tree planting, reflective surfaces, and green roofs.
Automated time-series analytics monitor shifts in green cover and thermal patterns over weeks or years. This reveals the impact of interventions and urban developments on environmental quality.
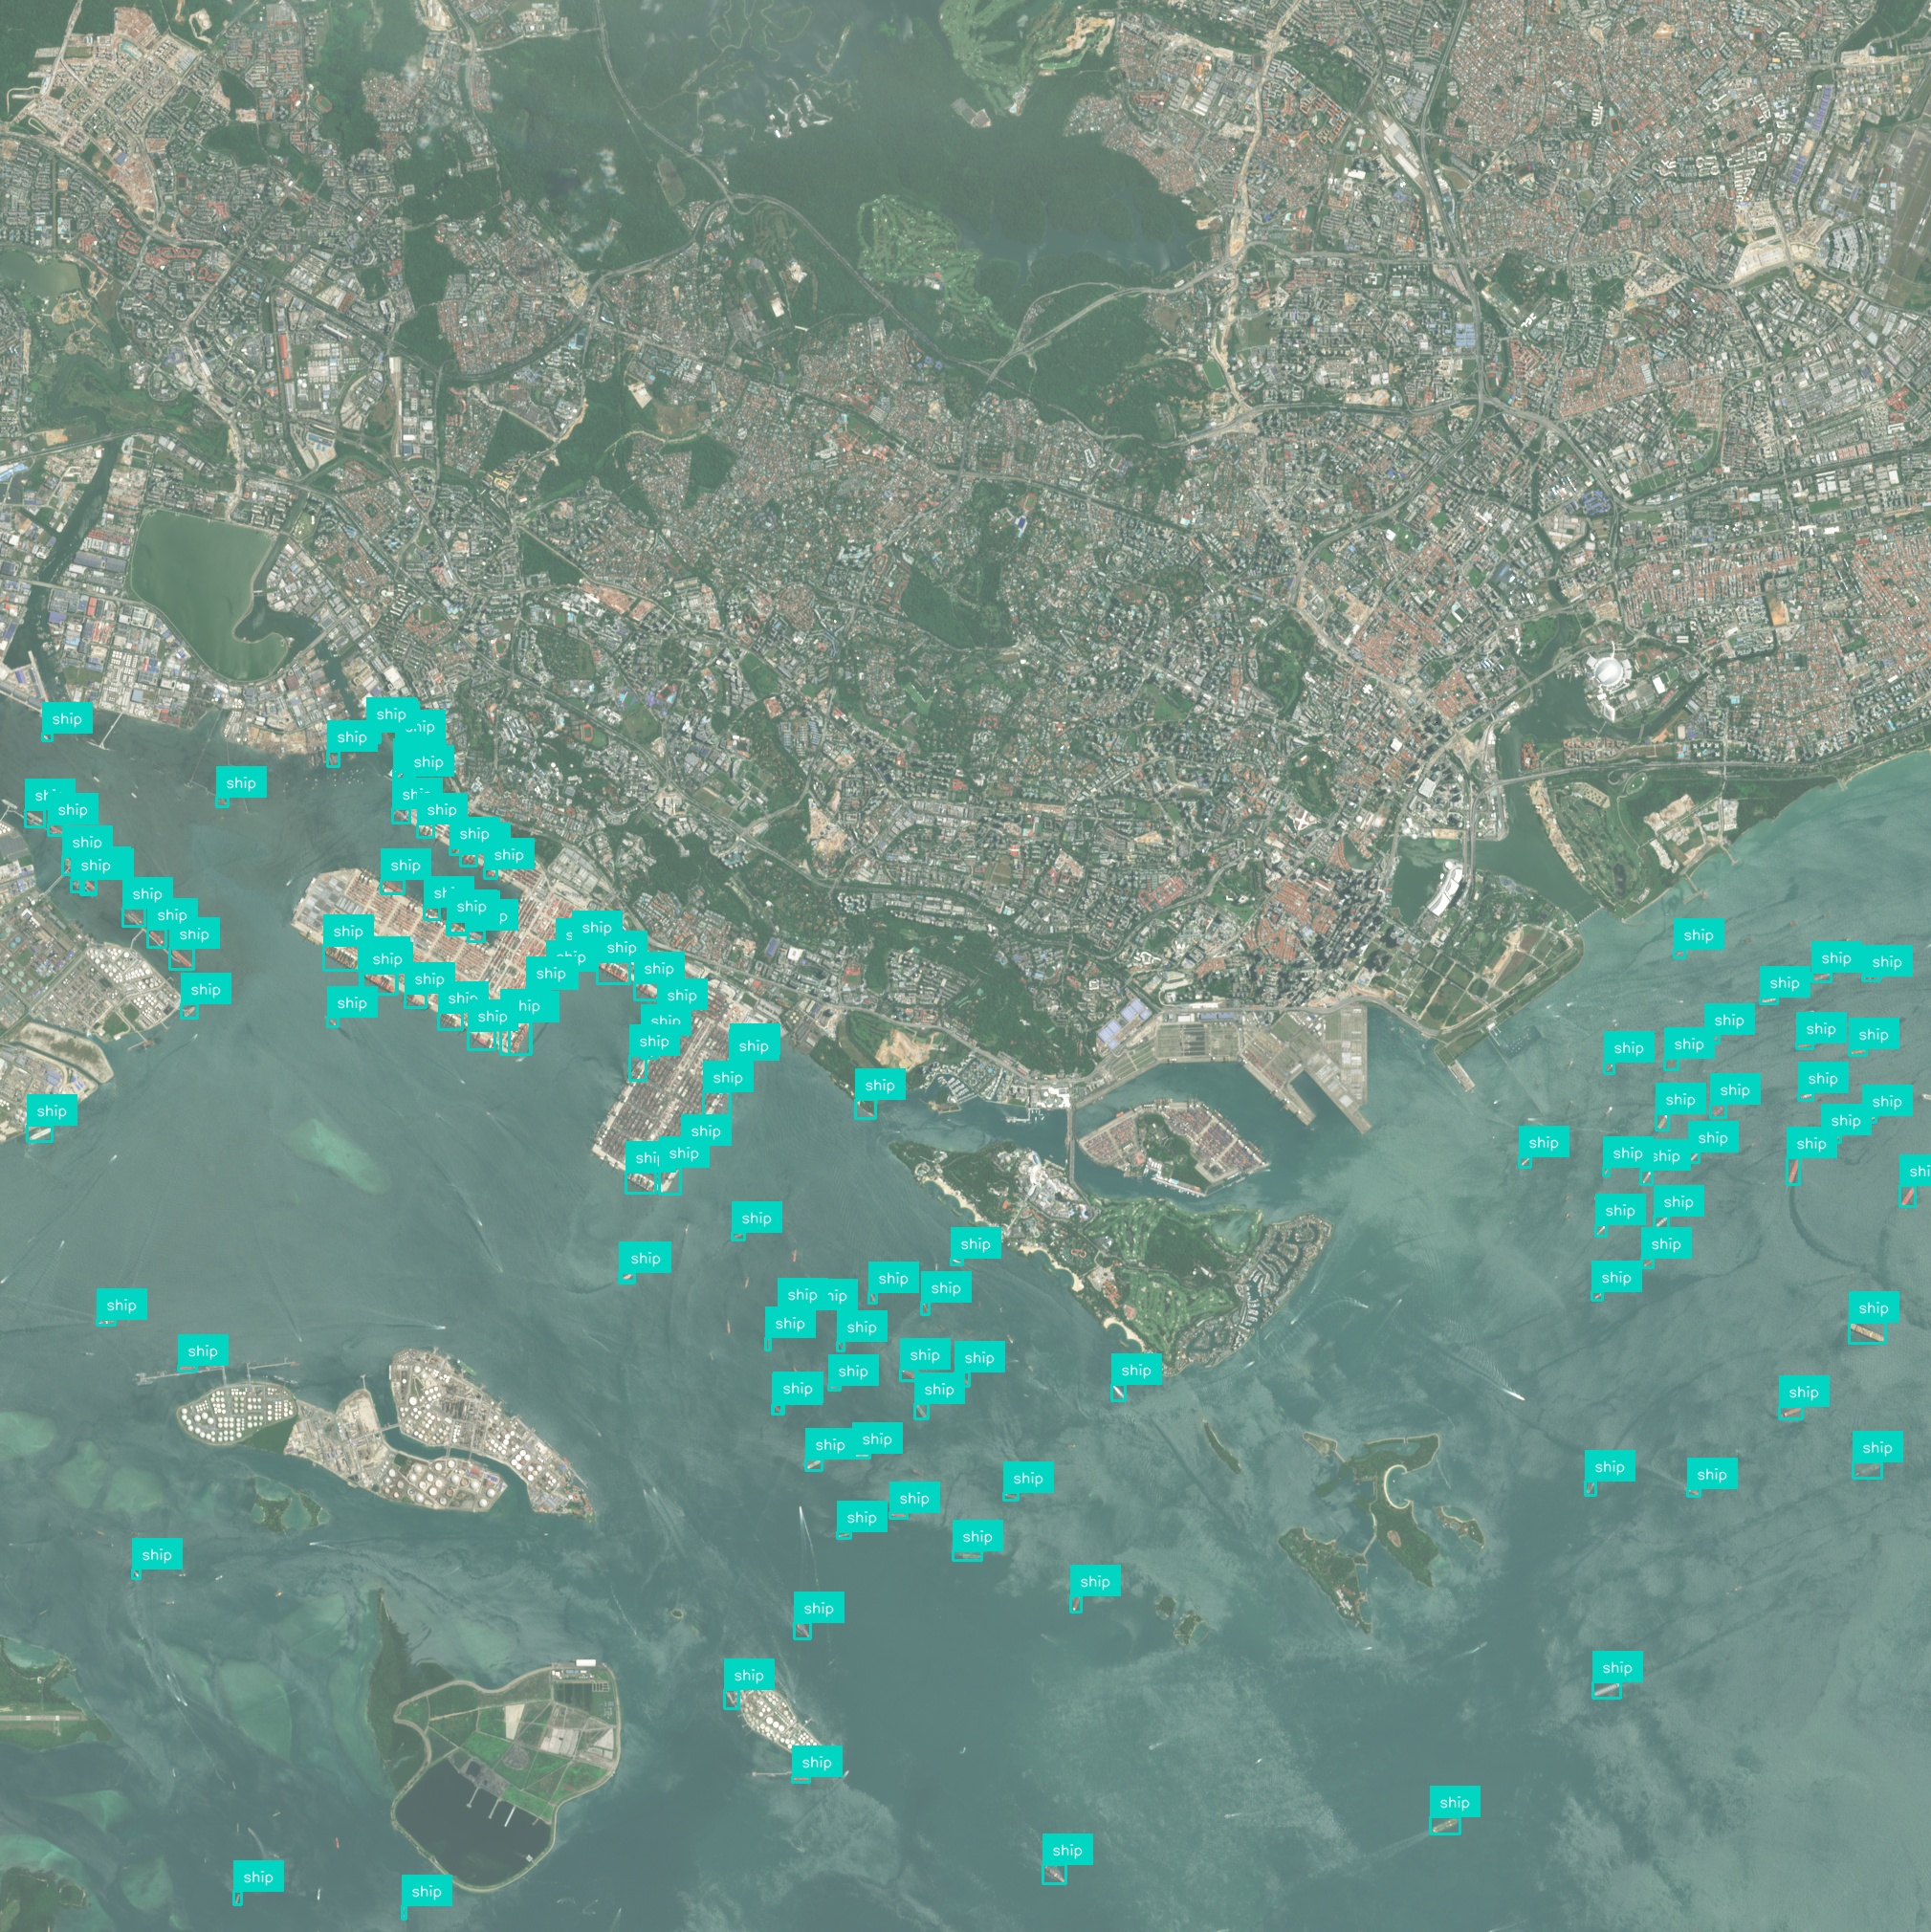
Cloud-based pipelines ingest satellite and drone imagery at city scale, ensuring rapid turnaround on large datasets. This enables analysis of thousands of square kilometers without manual processing.
Users can set thresholds for green loss or temperature rise to receive automated notifications. Detailed reports with maps and statistics facilitate stakeholder communication and compliance.
Results integrate seamlessly via standard GIS formats and REST APIs into planning and asset management systems. This streamlines workflows and supports cross-department collaboration.
Have a different question and can’t find the answer you’re looking for? Reach out to our support team by sending us an email and we’ll get back to you as soon as we can.
Geospatial AI Platform
AI & foundation models
Deep-learning and foundation models turn raw imagery into ready-to-use insights, so you ship answers instead of training pipelines.
Conversational workflow
Ask questions in plain language and the platform responds with charts, visualizations, and next step suggestions.
GPU-accelerated cloud
Cloud-native architecture spins up on-demand GPU clusters that scale from a single scene to global archives—no manual ops, no bottlenecks.
Any sensor, any format
Optical, SAR, drone, IoT, vector or raster—ingest, fuse, and analyze without conversion headaches.
Insight you can see
Real-time 2D / 3D maps and export-ready plots make results clear for engineers, execs, and clients alike.
Turn satellite, drone, and sensor data into clear, real-time insights using powerful AI – no complex setup, just answers you can see and act on.