Tunnel Progress
Combine satellite, LiDAR, and photogrammetry data to detect excavation fronts, measure advance rates, and optimize scheduling in tunnel construction projects.
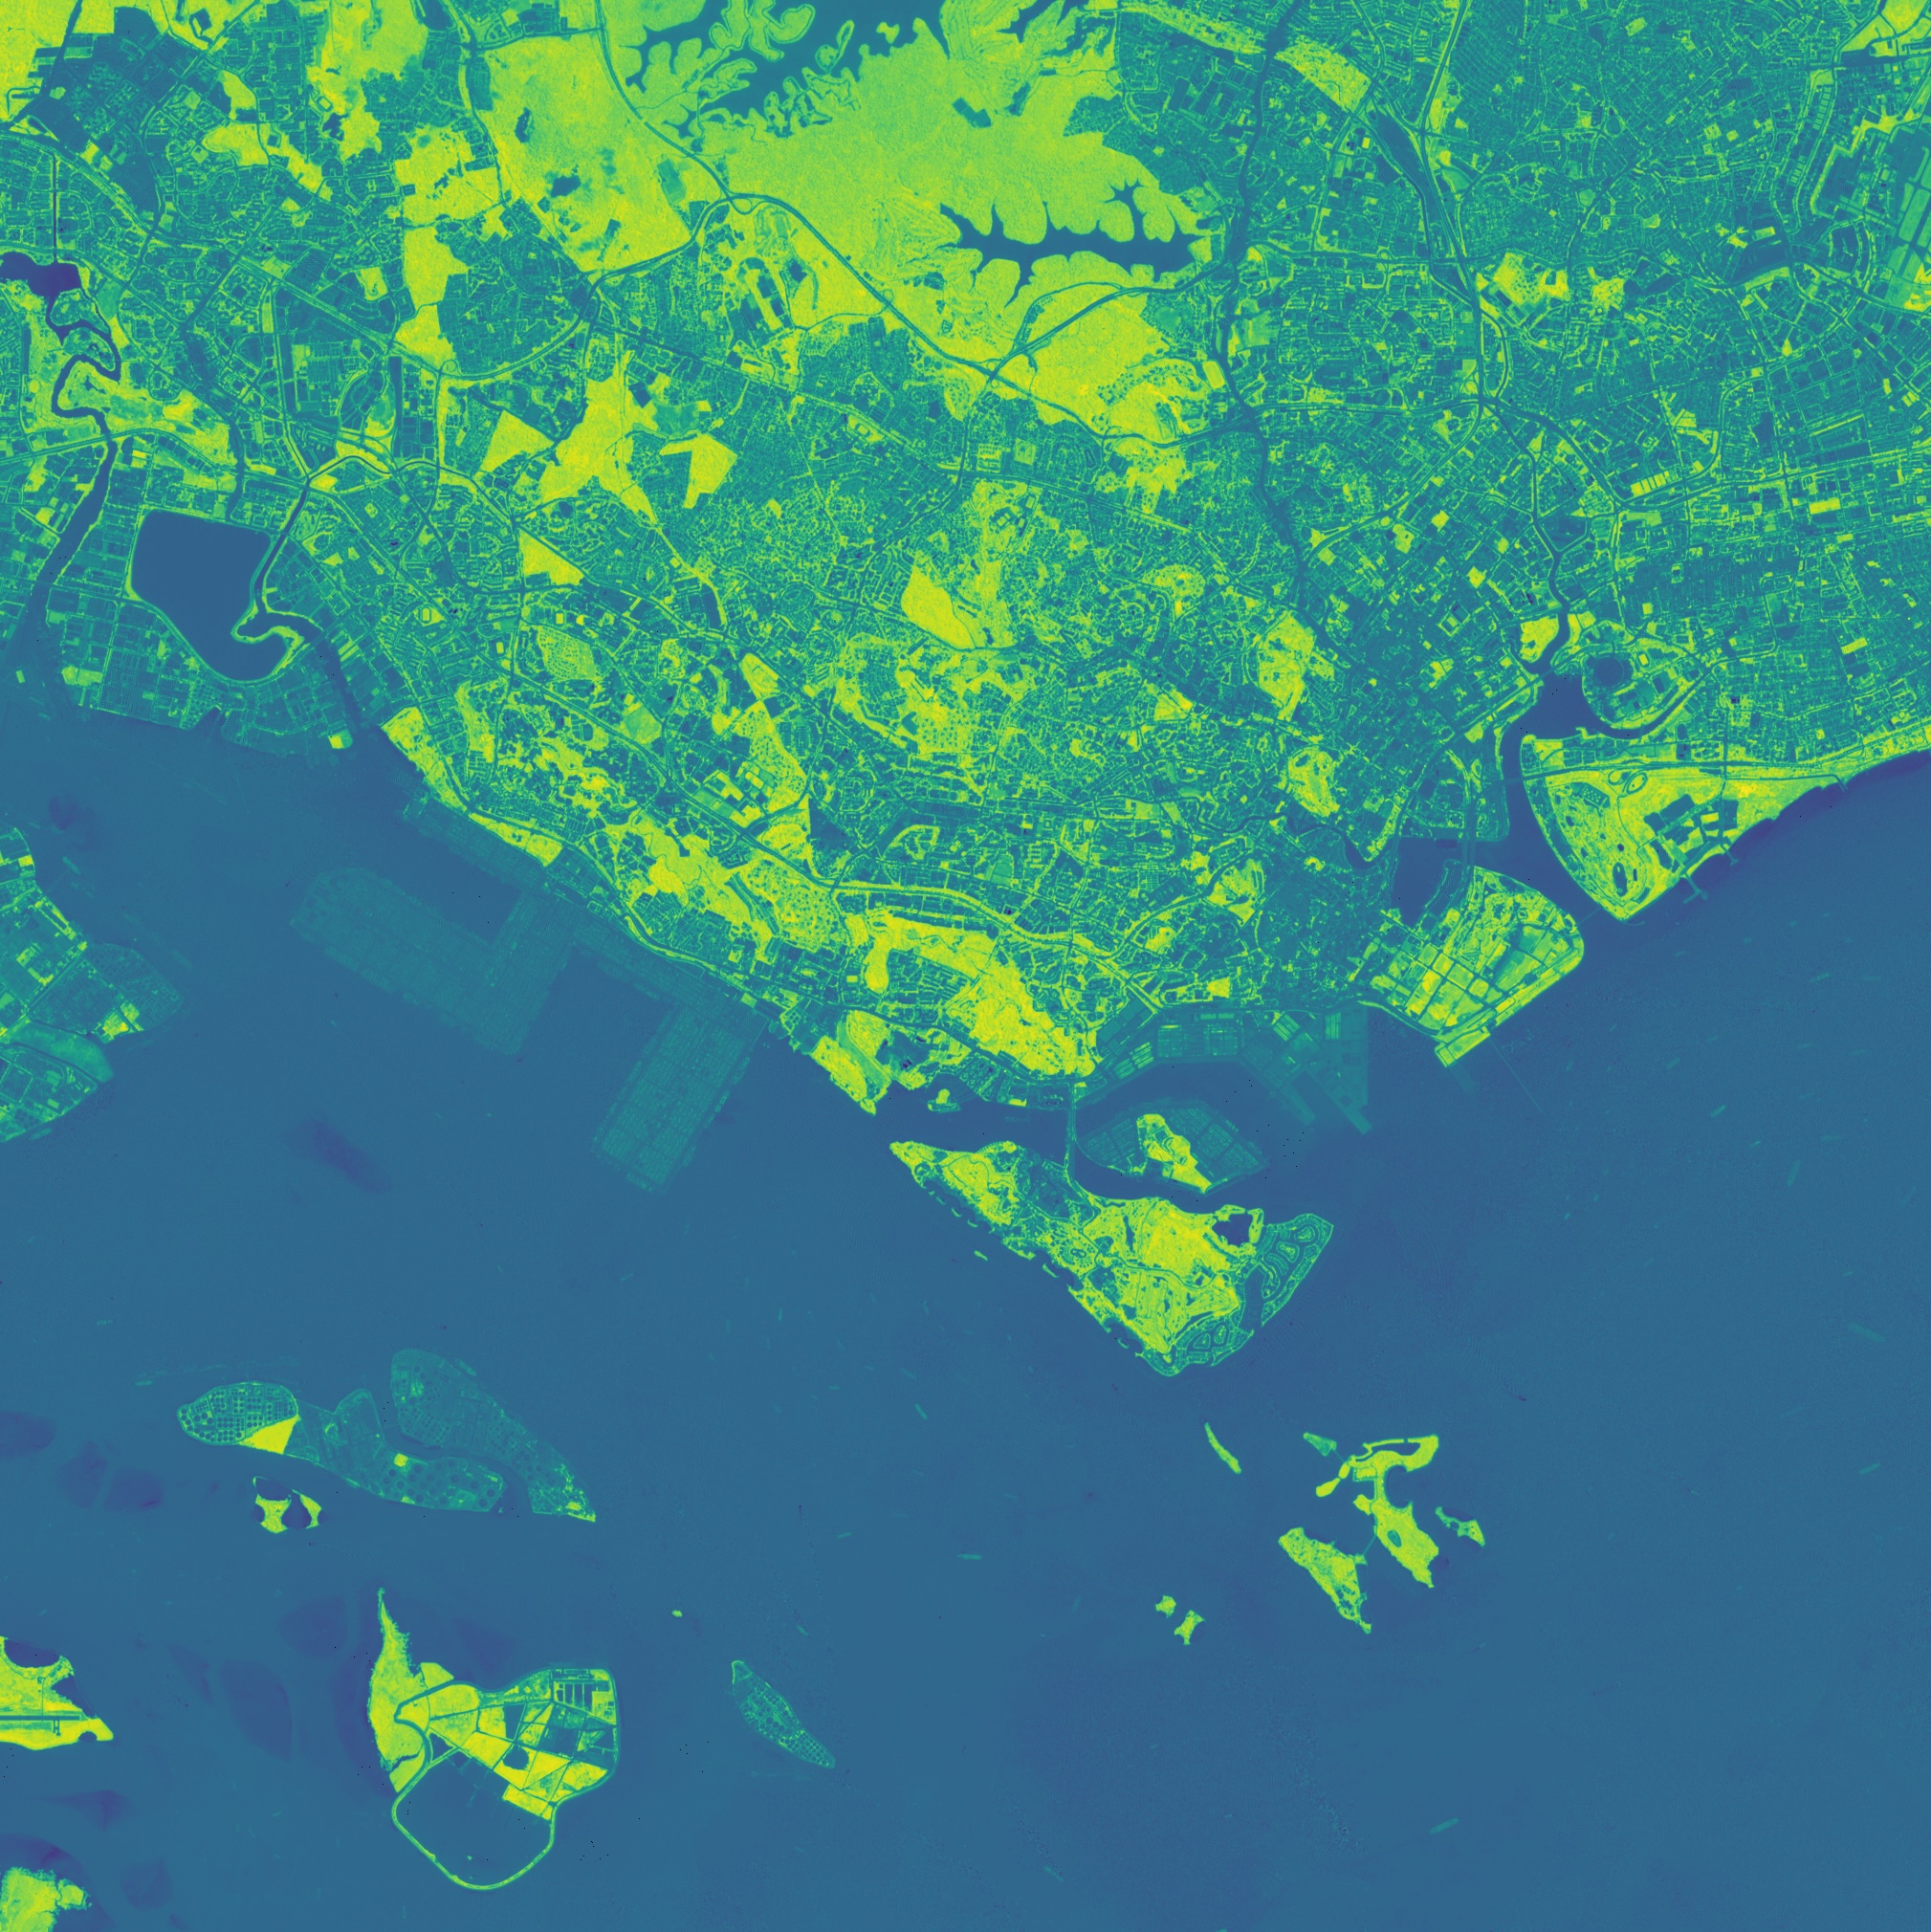
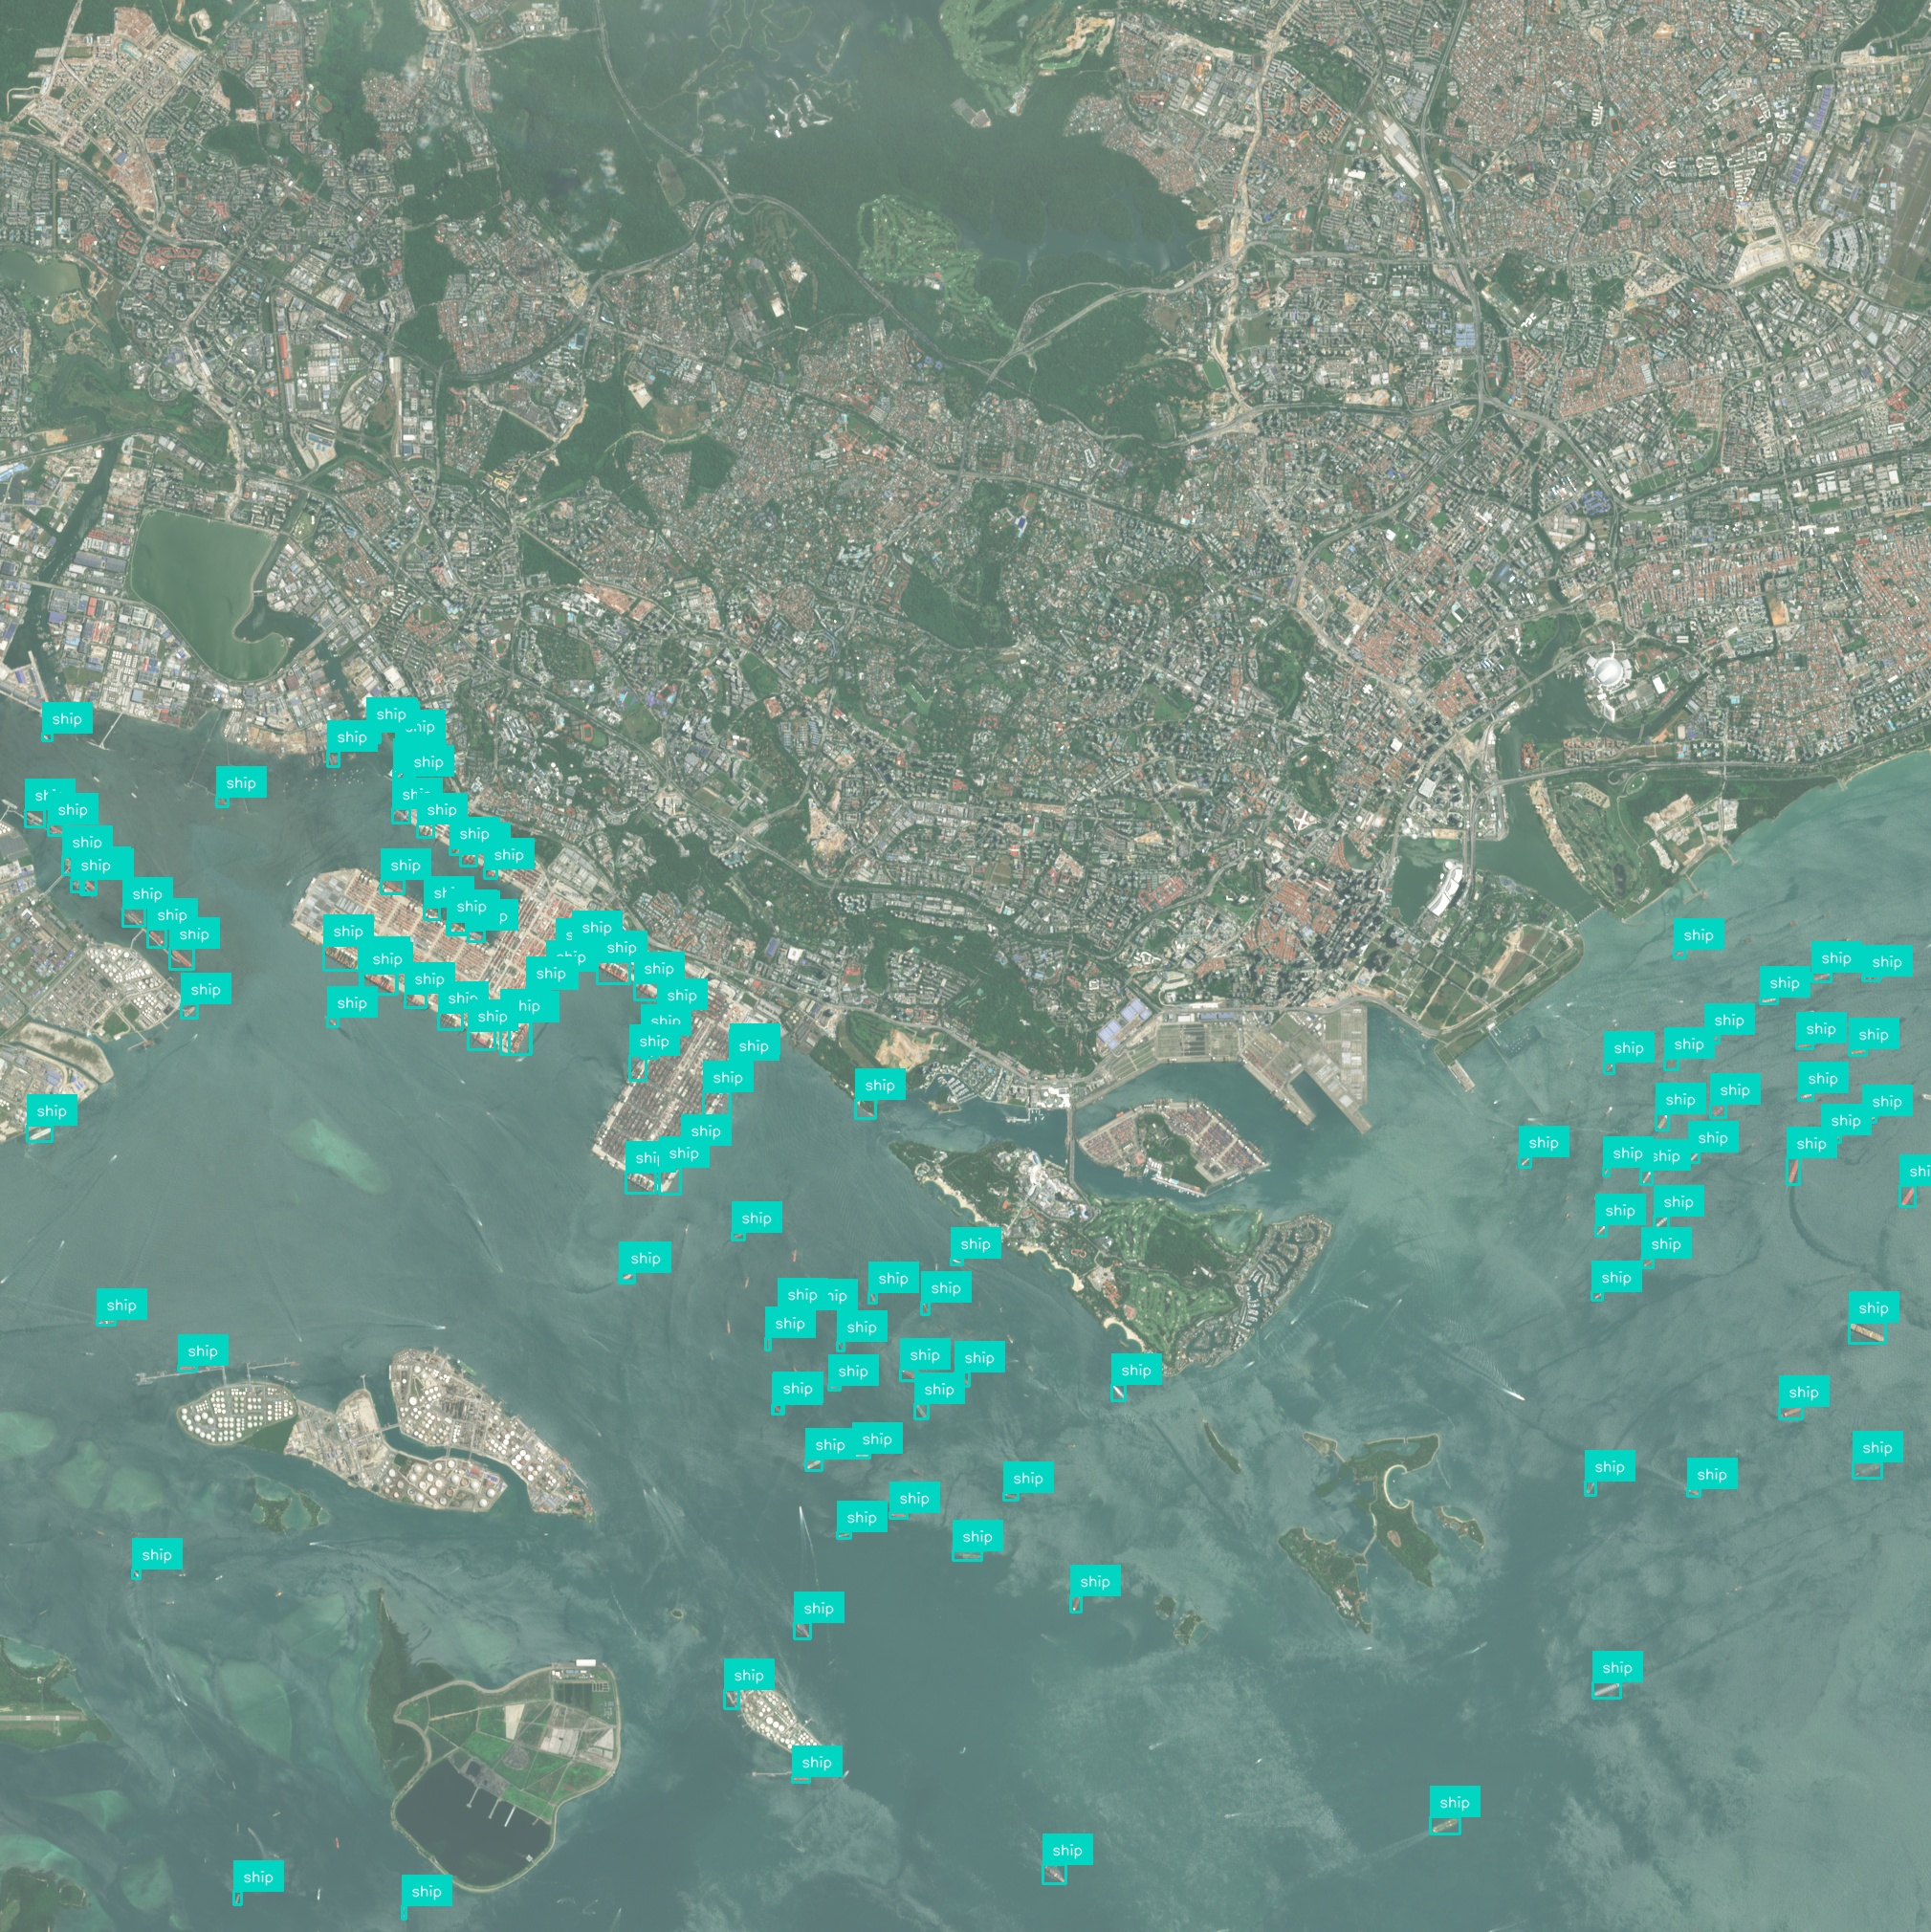
Combine satellite, LiDAR, and photogrammetry data to detect excavation fronts, measure advance rates, and optimize scheduling in tunnel construction projects.


How does it work?
Manual tunnel progress surveys rely on time-consuming field measurements and are vulnerable to human error and site hazards. Automated geospatial analysis accelerates progress tracking, providing accurate, near real-time excavation metrics that improve decision-making and safety.
Automated processing of satellite and drone imagery delivers near real-time excavation front positions. This enables immediate adjustments to operations, reducing idle time and enhancing site coordination.
3D point clouds from LiDAR and photogrammetry compute precise excavation volumes. Construction teams can validate contractor claims and optimize material transport plans.
Early detection of unexpected ground conditions or overbreak zones triggers prompt inspections. This proactive approach minimizes worker exposure to hazardous conditions and unplanned stoppages.
Up-to-date progress metrics inform allocation of machinery and workforce based on actual excavation rates. This reduces equipment idling and labor costs while maintaining project momentum.
Progress detection integrates with project management tools to compare actual versus planned excavation timelines. Deviations are flagged automatically, enabling schedule corrections and stakeholder reporting.
Archival geospatial datasets allow analysis of excavation rates over time and across different tunnel sections. Insights support continuous improvement and risk assessment for future projects.
Have a different question and can’t find the answer you’re looking for? Reach out to our support team by sending us an email and we’ll get back to you as soon as we can.
Geospatial AI Platform

AI & foundation models
Deep-learning and foundation models turn raw imagery into ready-to-use insights, so you ship answers instead of training pipelines.

Conversational workflow
Ask questions in plain language and the platform responds with charts, visualizations, and next step suggestions.

GPU-accelerated cloud
Cloud-native architecture spins up on-demand GPU clusters that scale from a single scene to global archives—no manual ops, no bottlenecks.

Any sensor, any format
Optical, SAR, drone, IoT, vector or raster—ingest, fuse, and analyze without conversion headaches.

Insight you can see
Real-time 2D / 3D maps and export-ready plots make results clear for engineers, execs, and clients alike.
Turn satellite, drone, and sensor data into clear, real-time insights using powerful AI – no complex setup, just answers you can see and act on.