Storm Damage Map
Rapid satellite and drone analytics pinpoint grid asset damage after severe storms, accelerating repairs and minimizing outage duration.
Rapid satellite and drone analytics pinpoint grid asset damage after severe storms, accelerating repairs and minimizing outage duration.
How does it work?
Utilities often face lengthy manual inspections and safety risks when assessing widespread grid damage after severe storms. AI-driven geospatial analytics automates damage detection from satellite and drone imagery, delivering rapid, actionable maps to prioritize repairs.
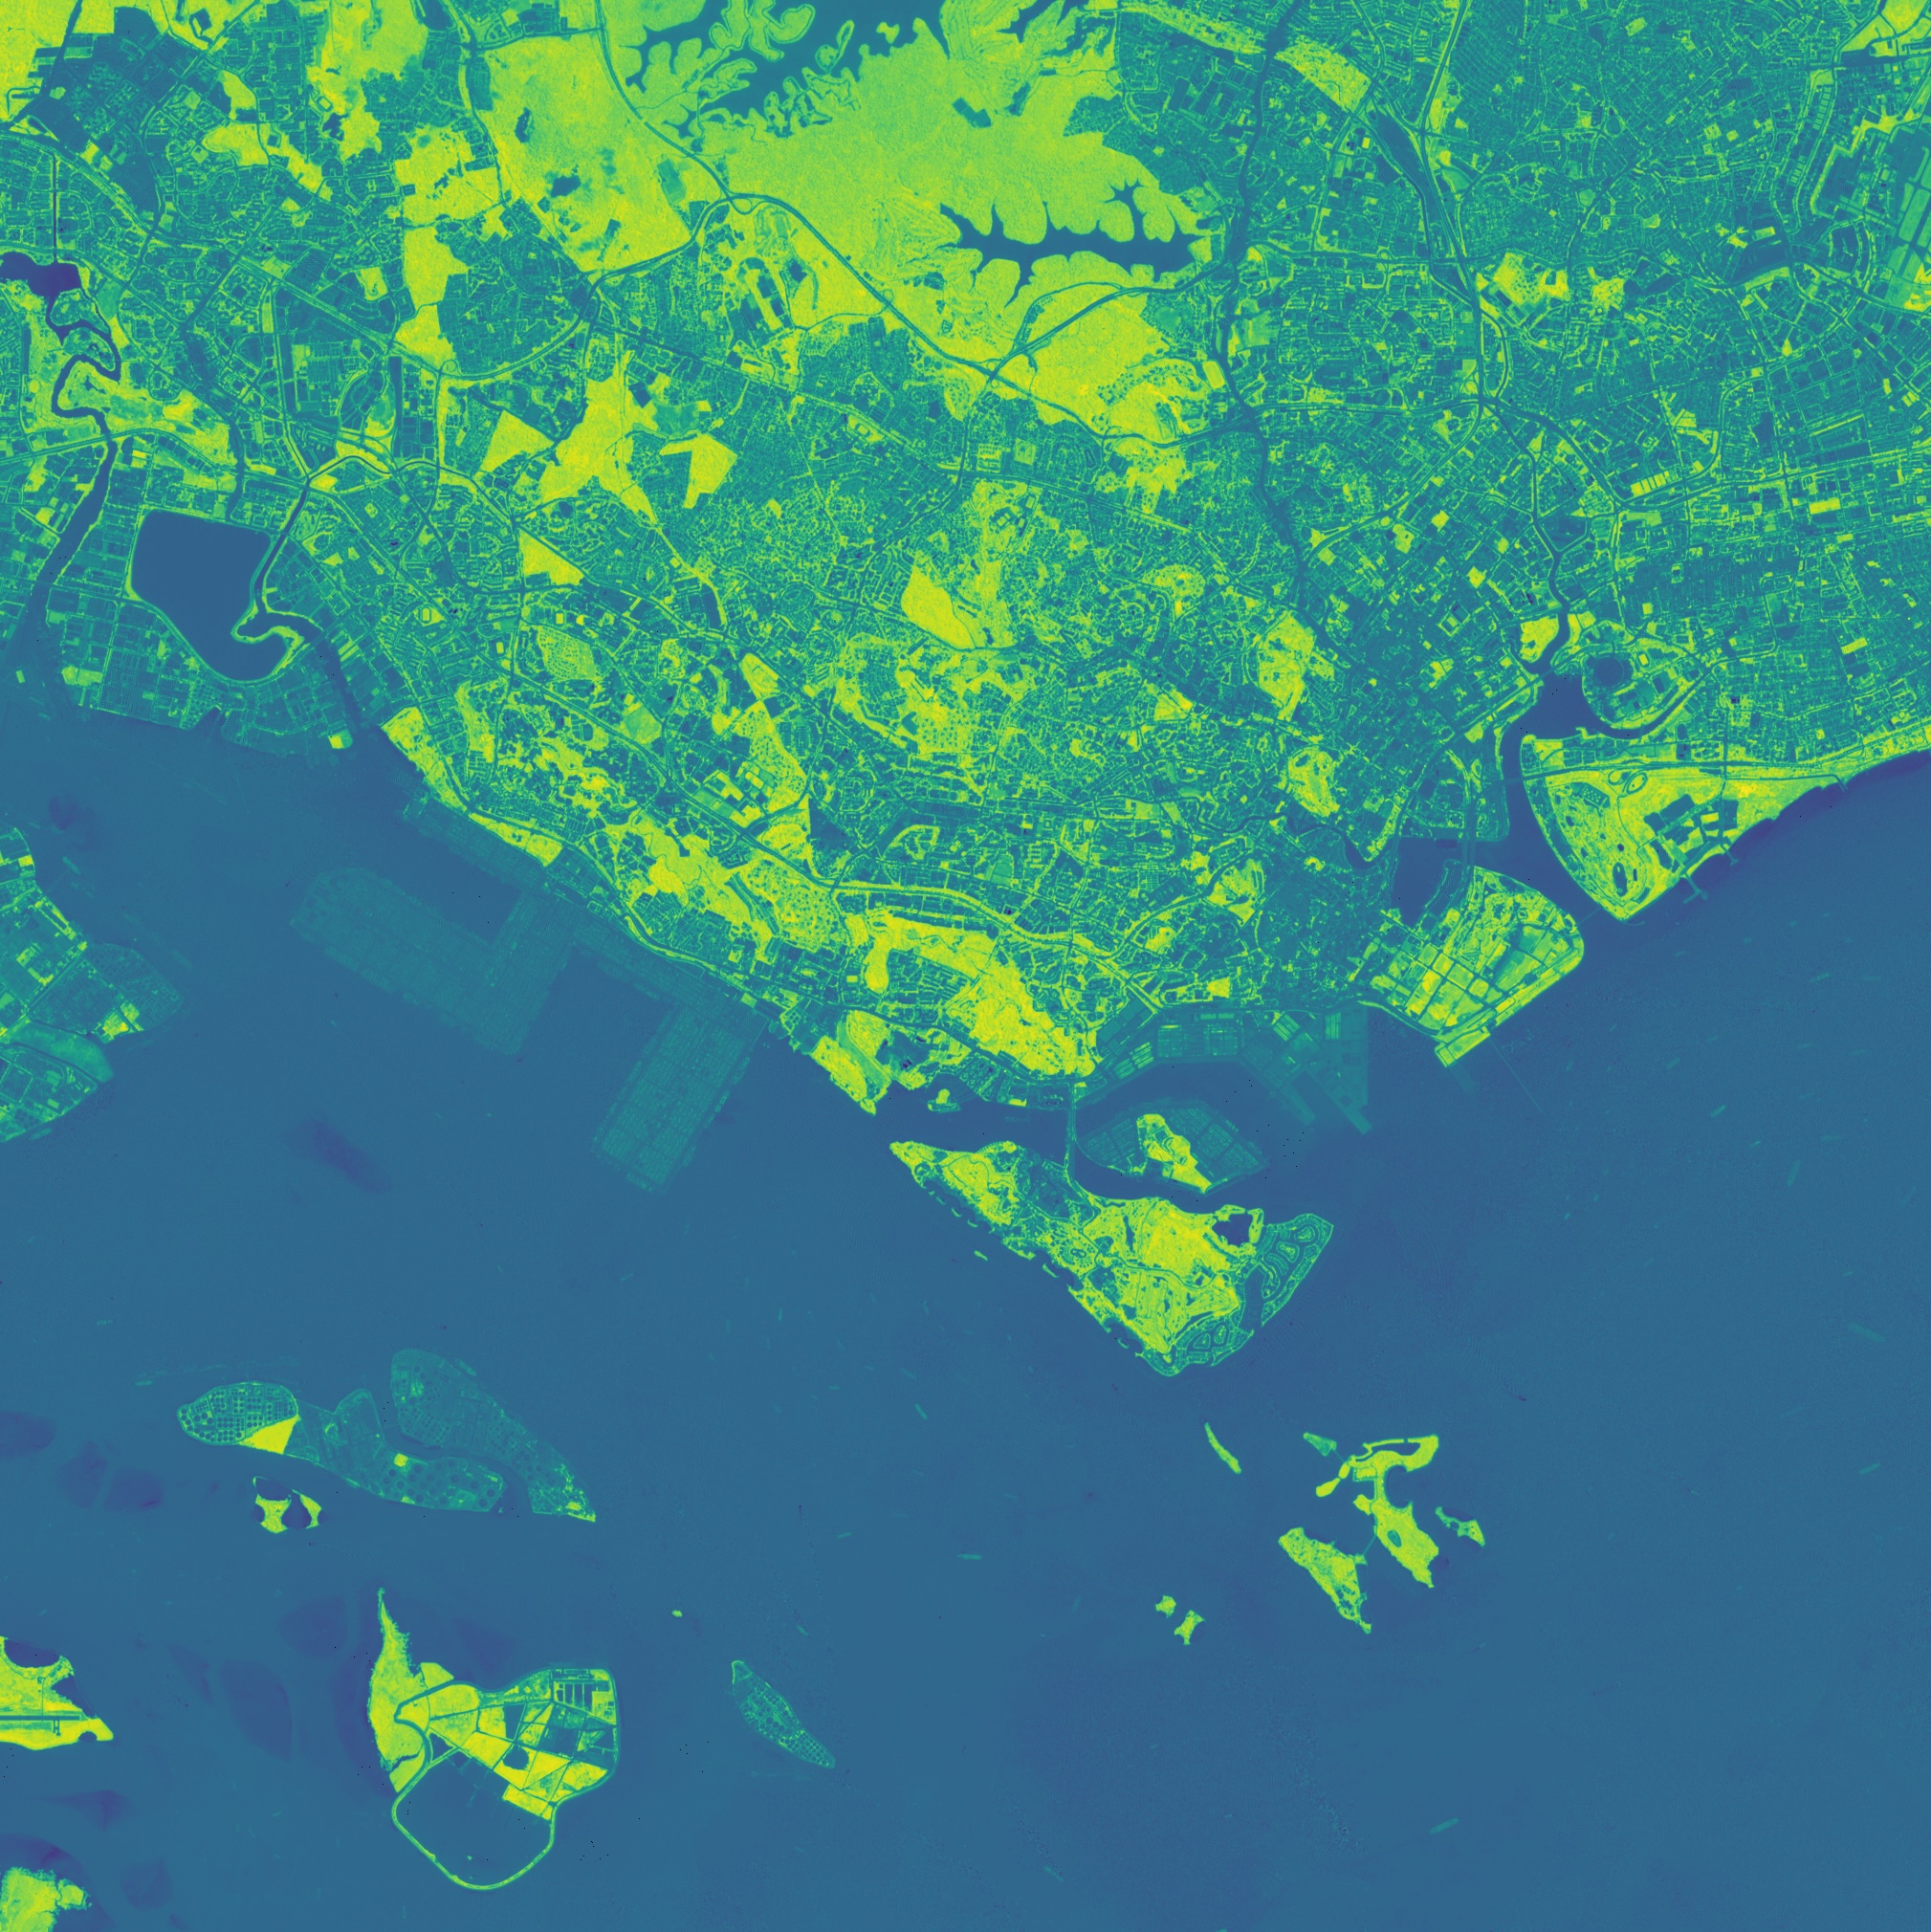
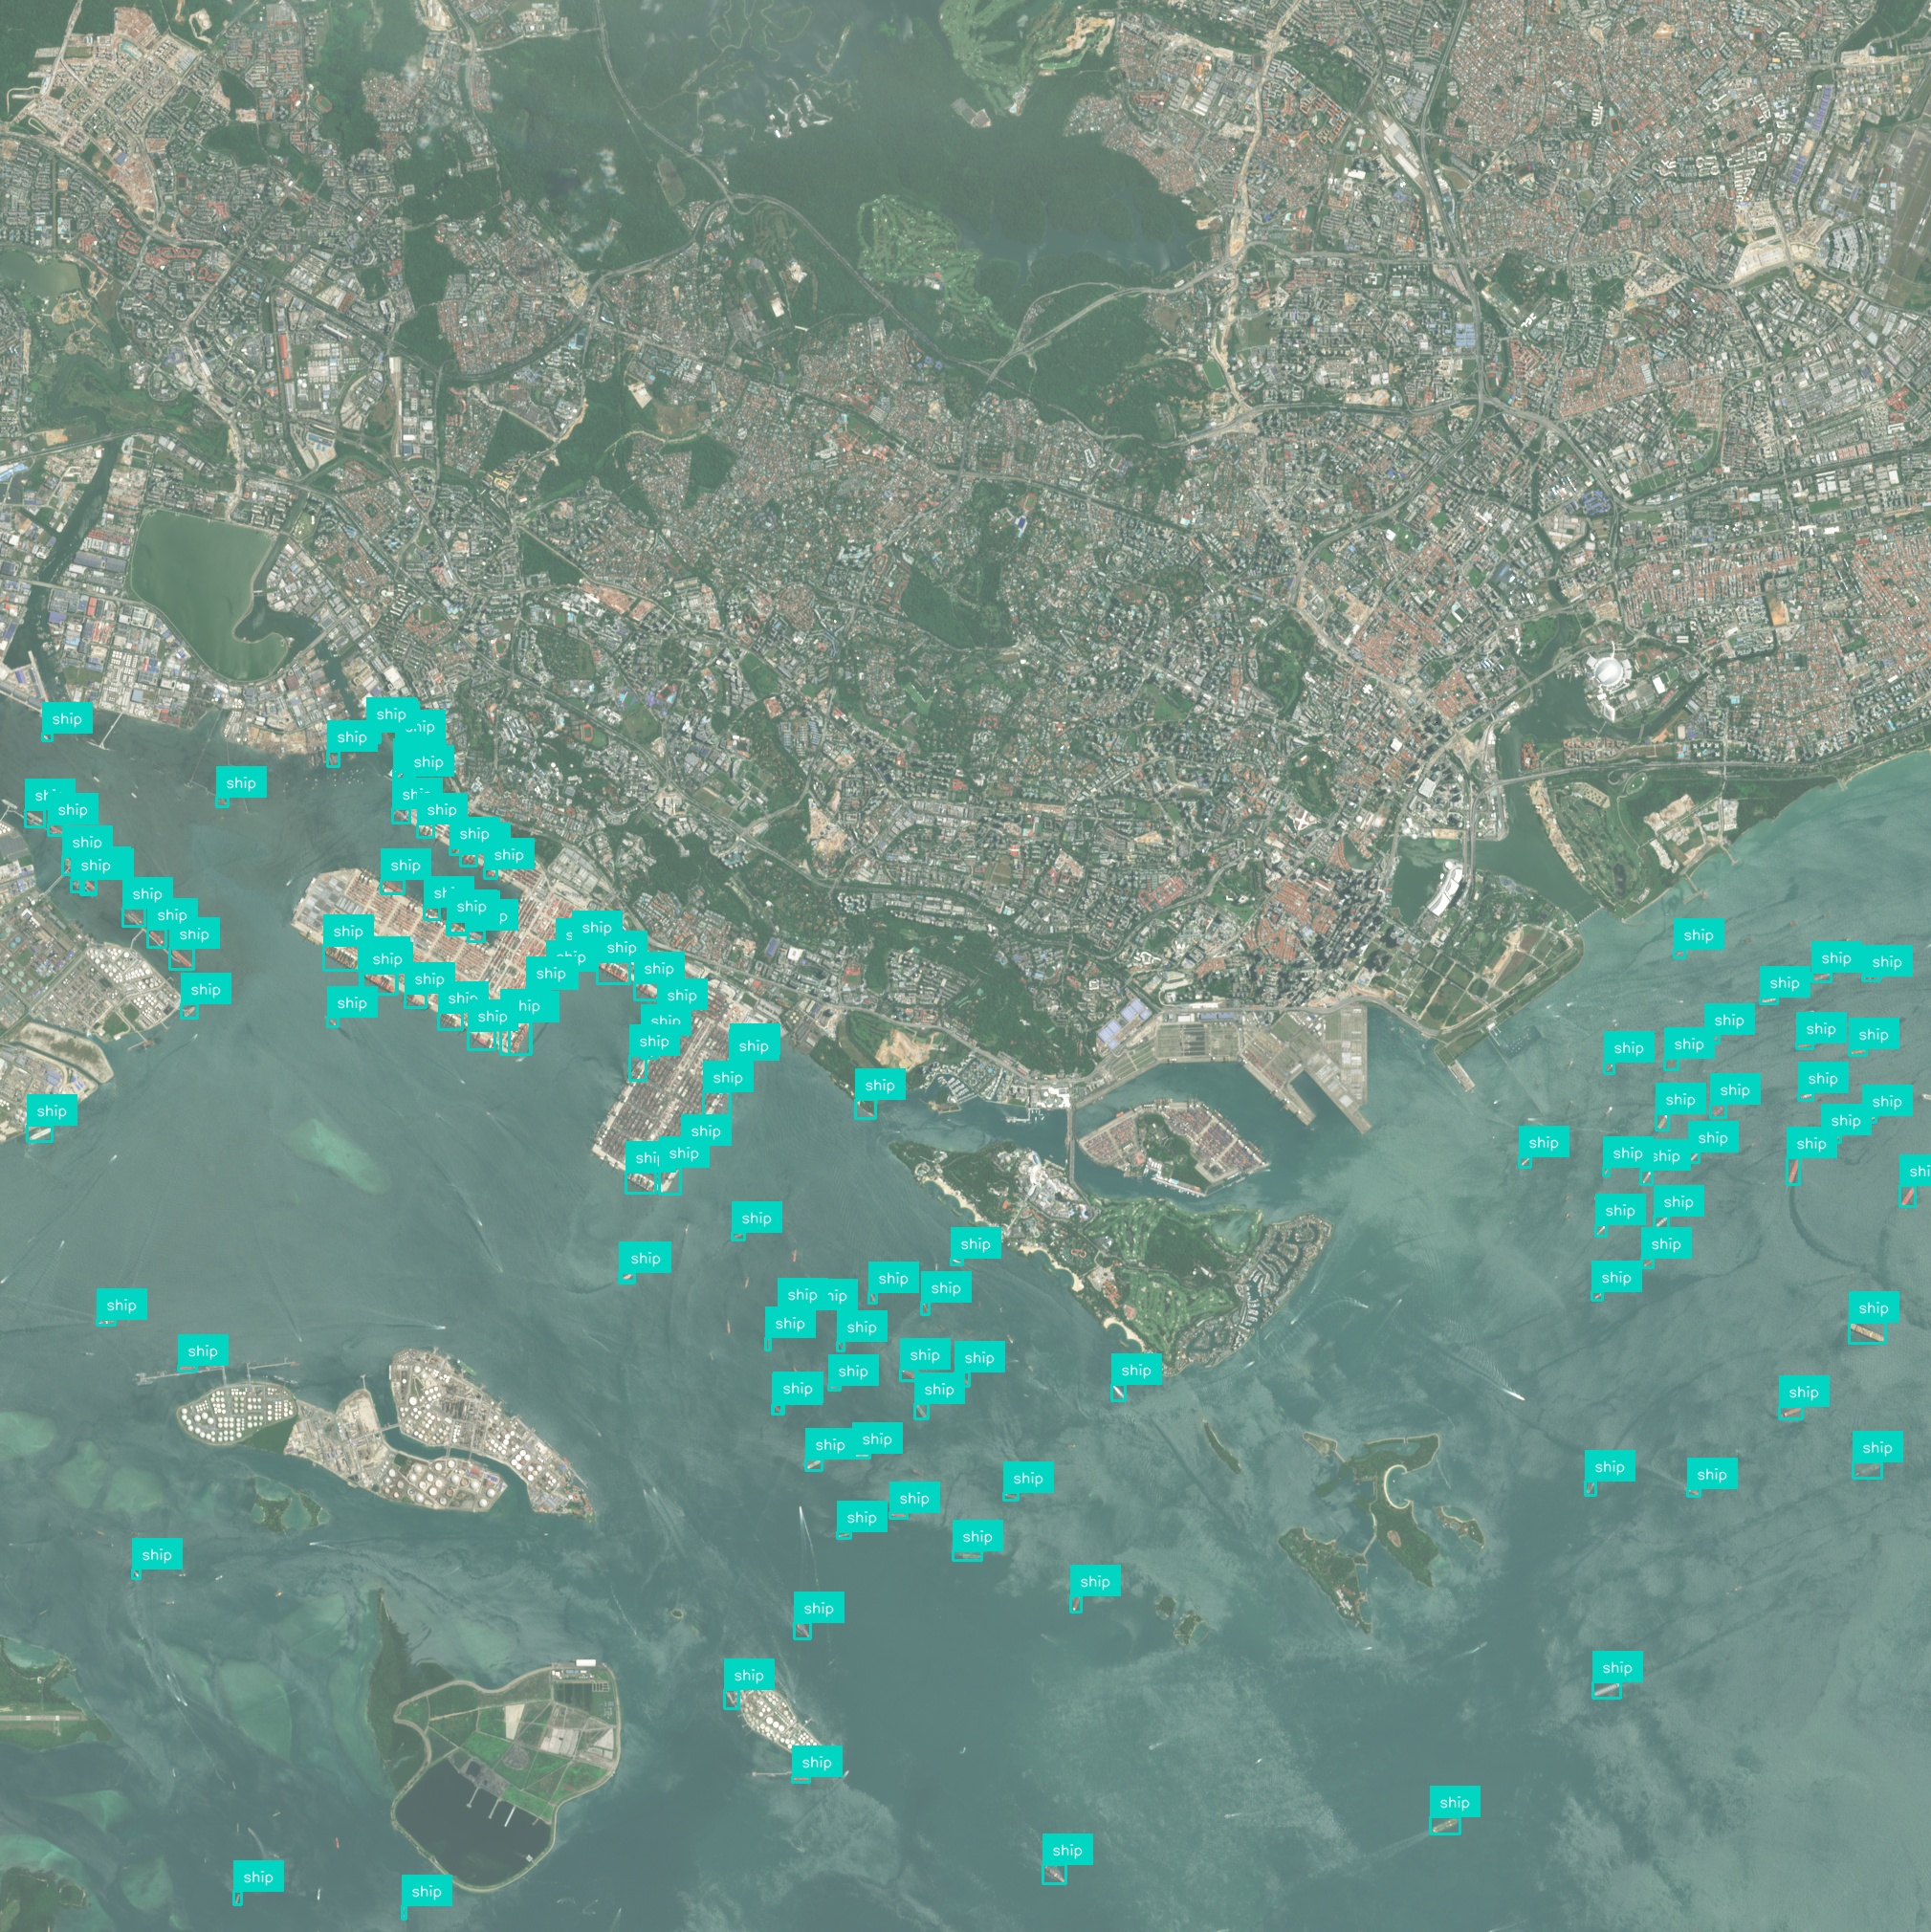
Our AI models analyze high-resolution satellite and drone imagery to identify damaged poles, lines, and equipment within hours. This reduces assessment time from days to mere hours, enabling faster decision-making.
Remote damage assessment removes the need for crews to navigate unsafe, storm-affected areas for initial inspections. It minimizes exposure to live wires, debris, and flooding, improving overall crew safety.
Damage severity and location data feed into automated prioritization algorithms to rank repair tasks by criticality and accessibility. Field teams receive focused work orders, optimizing resource allocation and reducing downtime.
Automating inspection workflows cuts manual surveying costs by up to 50%, according to industry benchmarks. Reduced field hours and travel lower operational expenses while maintaining comprehensive coverage.
The platform processes imagery across thousands of square kilometers, ensuring no damaged asset is overlooked. High revisit rates from multiple data sources guarantee up-to-date assessments.
Damage detection outputs integrate directly with existing GIS, OMS, and asset management systems via standard APIs. This ensures consistent data flow and simplifies dashboarding and reporting.
Have a different question and can’t find the answer you’re looking for? Reach out to our support team by sending us an email and we’ll get back to you as soon as we can.
Geospatial AI Platform
AI & foundation models
Deep-learning and foundation models turn raw imagery into ready-to-use insights, so you ship answers instead of training pipelines.
Conversational workflow
Ask questions in plain language and the platform responds with charts, visualizations, and next step suggestions.
GPU-accelerated cloud
Cloud-native architecture spins up on-demand GPU clusters that scale from a single scene to global archives—no manual ops, no bottlenecks.
Any sensor, any format
Optical, SAR, drone, IoT, vector or raster—ingest, fuse, and analyze without conversion headaches.
Insight you can see
Real-time 2D / 3D maps and export-ready plots make results clear for engineers, execs, and clients alike.
Turn satellite, drone, and sensor data into clear, real-time insights using powerful AI – no complex setup, just answers you can see and act on.