Track Settlement
Continuous geospatial analysis detects and predicts rail track-bed settlement, enabling proactive maintenance planning and reducing service disruptions and safety risks.
Continuous geospatial analysis detects and predicts rail track-bed settlement, enabling proactive maintenance planning and reducing service disruptions and safety risks.
How does it work?
Undetected track-bed settlement can lead to alignment issues, safety hazards, and costly emergency repairs along rail corridors. Geospatial analytics provides high-resolution deformation mapping and trend prediction, enabling early detection and targeted maintenance to ensure safe, reliable operations.
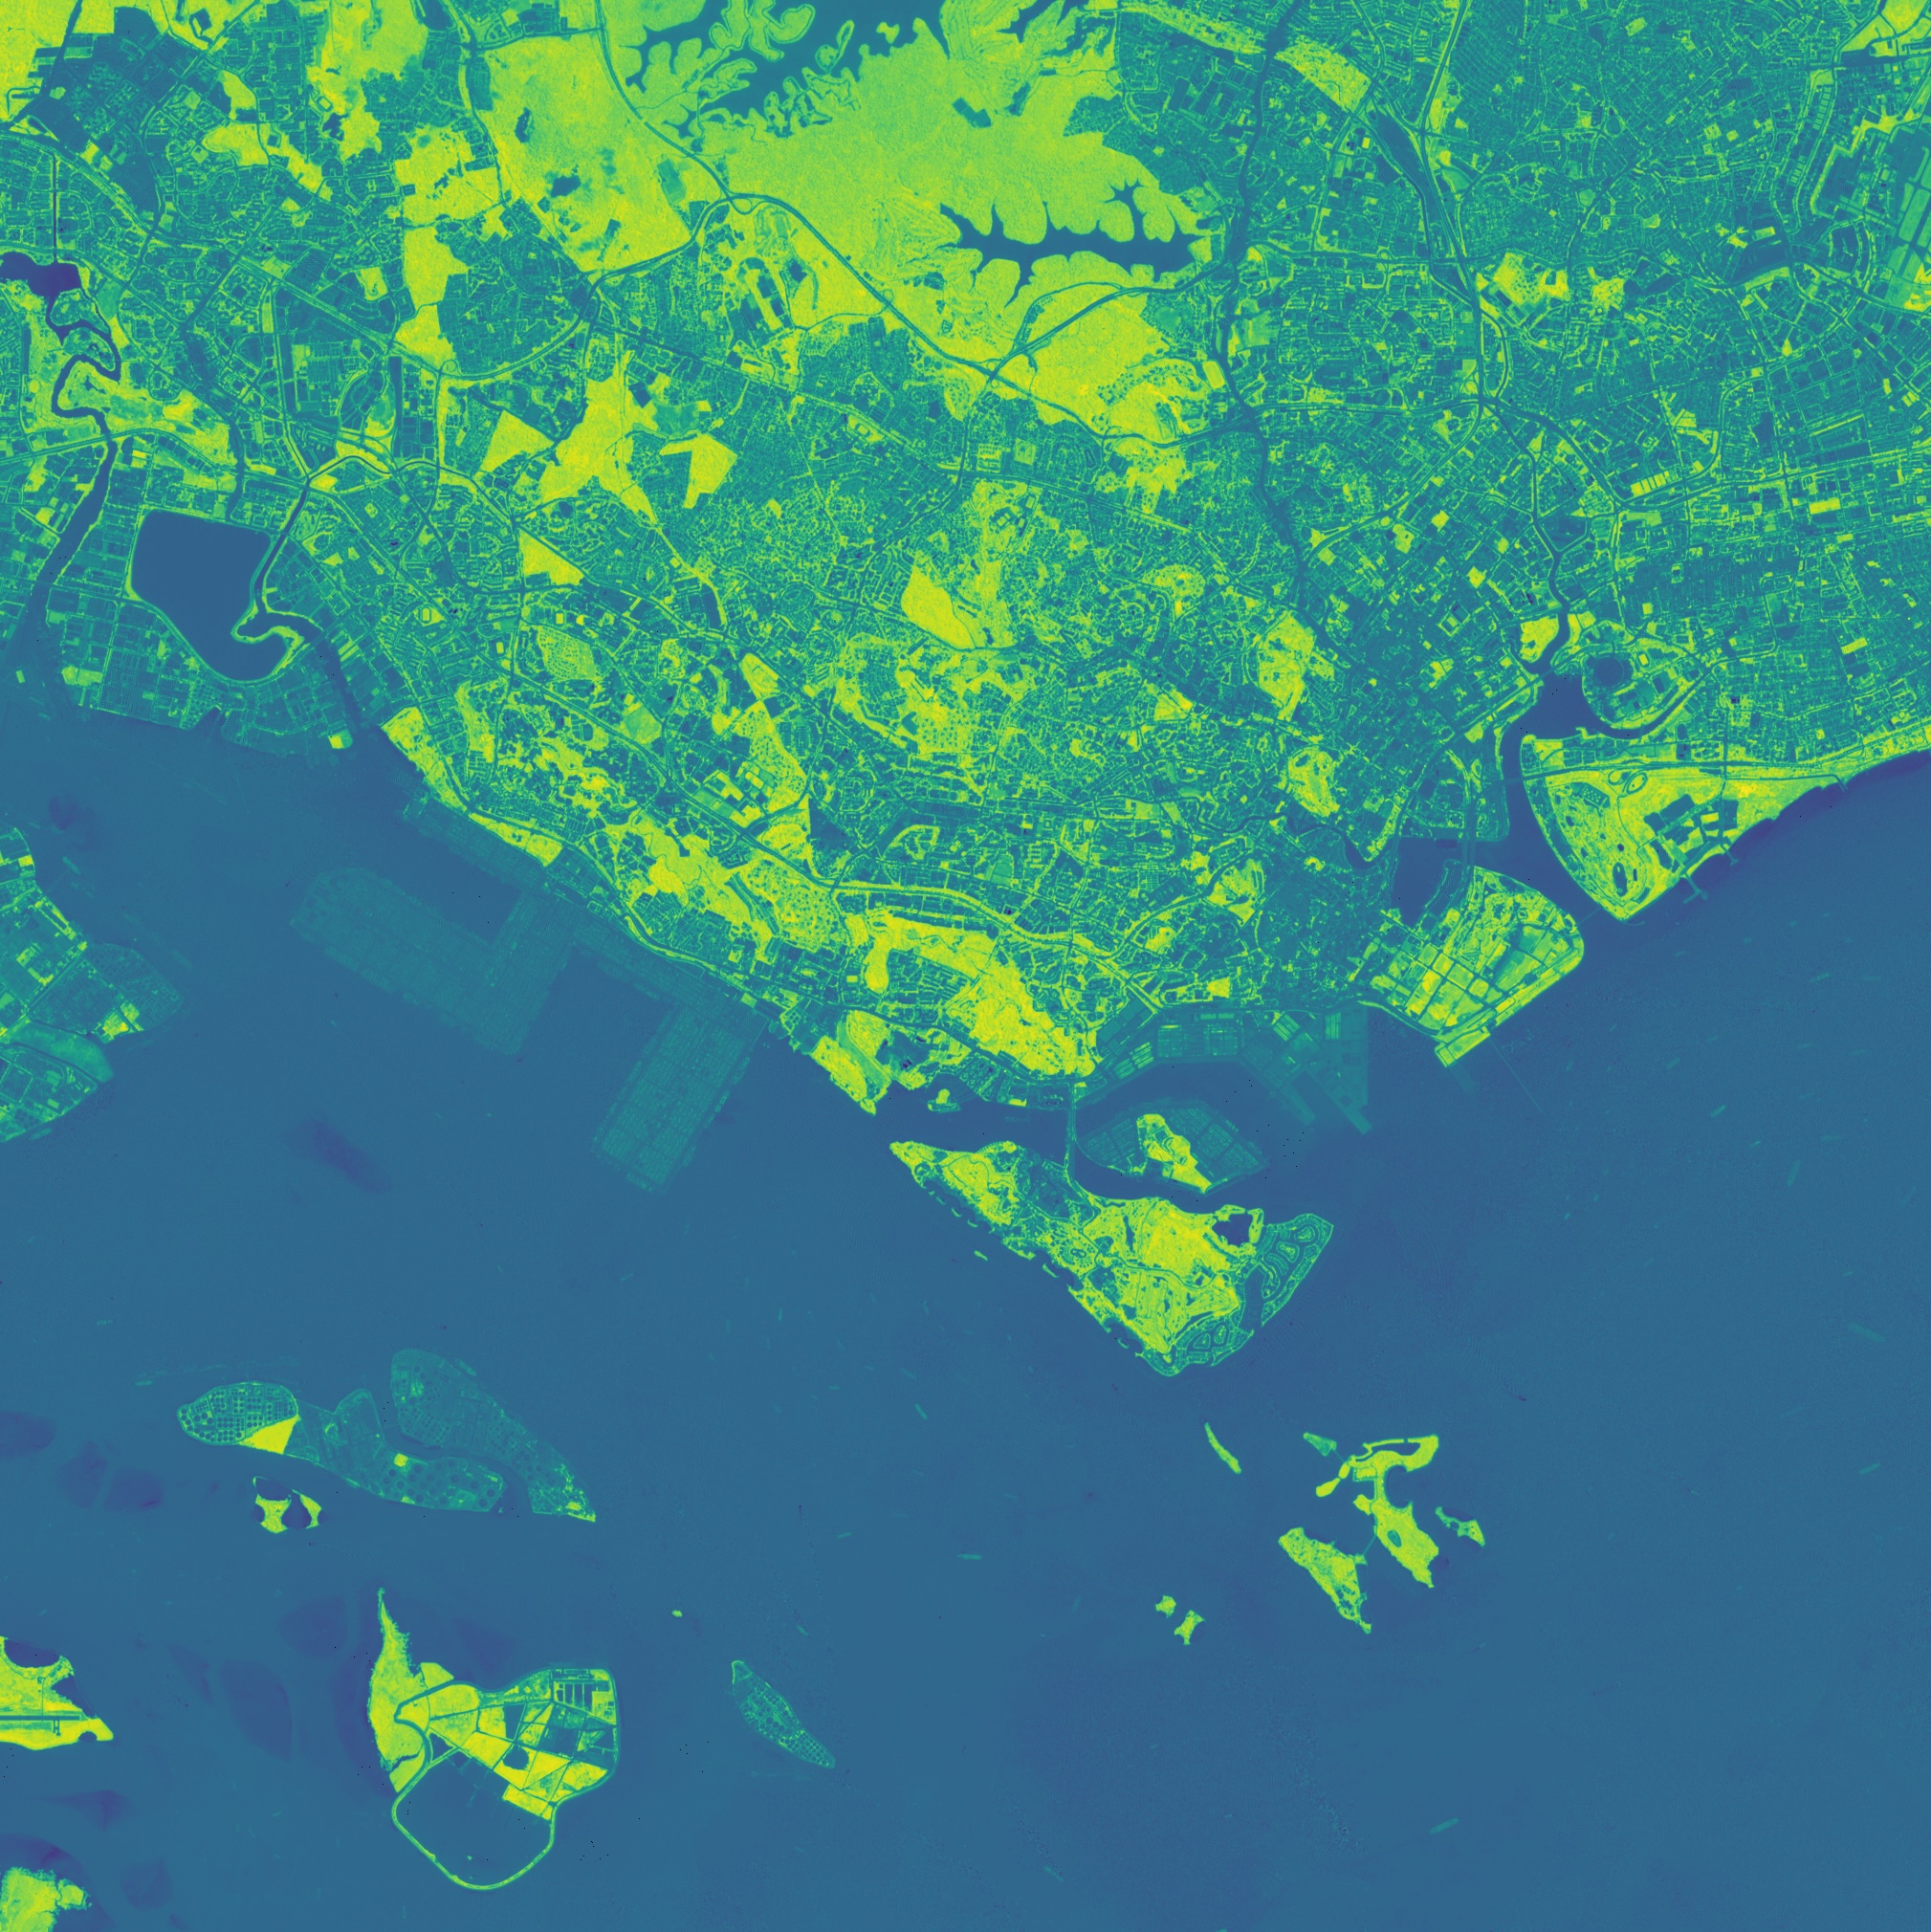
Combines satellite and drone imagery with ground sensors to produce centimeter-level displacement maps. This clarity highlights minute deformations before they escalate into critical faults.
Automated thresholds trigger alerts when settlement exceeds safe limits. Maintenance teams receive actionable notifications to prioritize inspections and repairs promptly.
Machine learning models analyze historical and real-time data to forecast settlement trends. Predictive insights guide proactive maintenance, reducing reactive interventions by up to 30%.
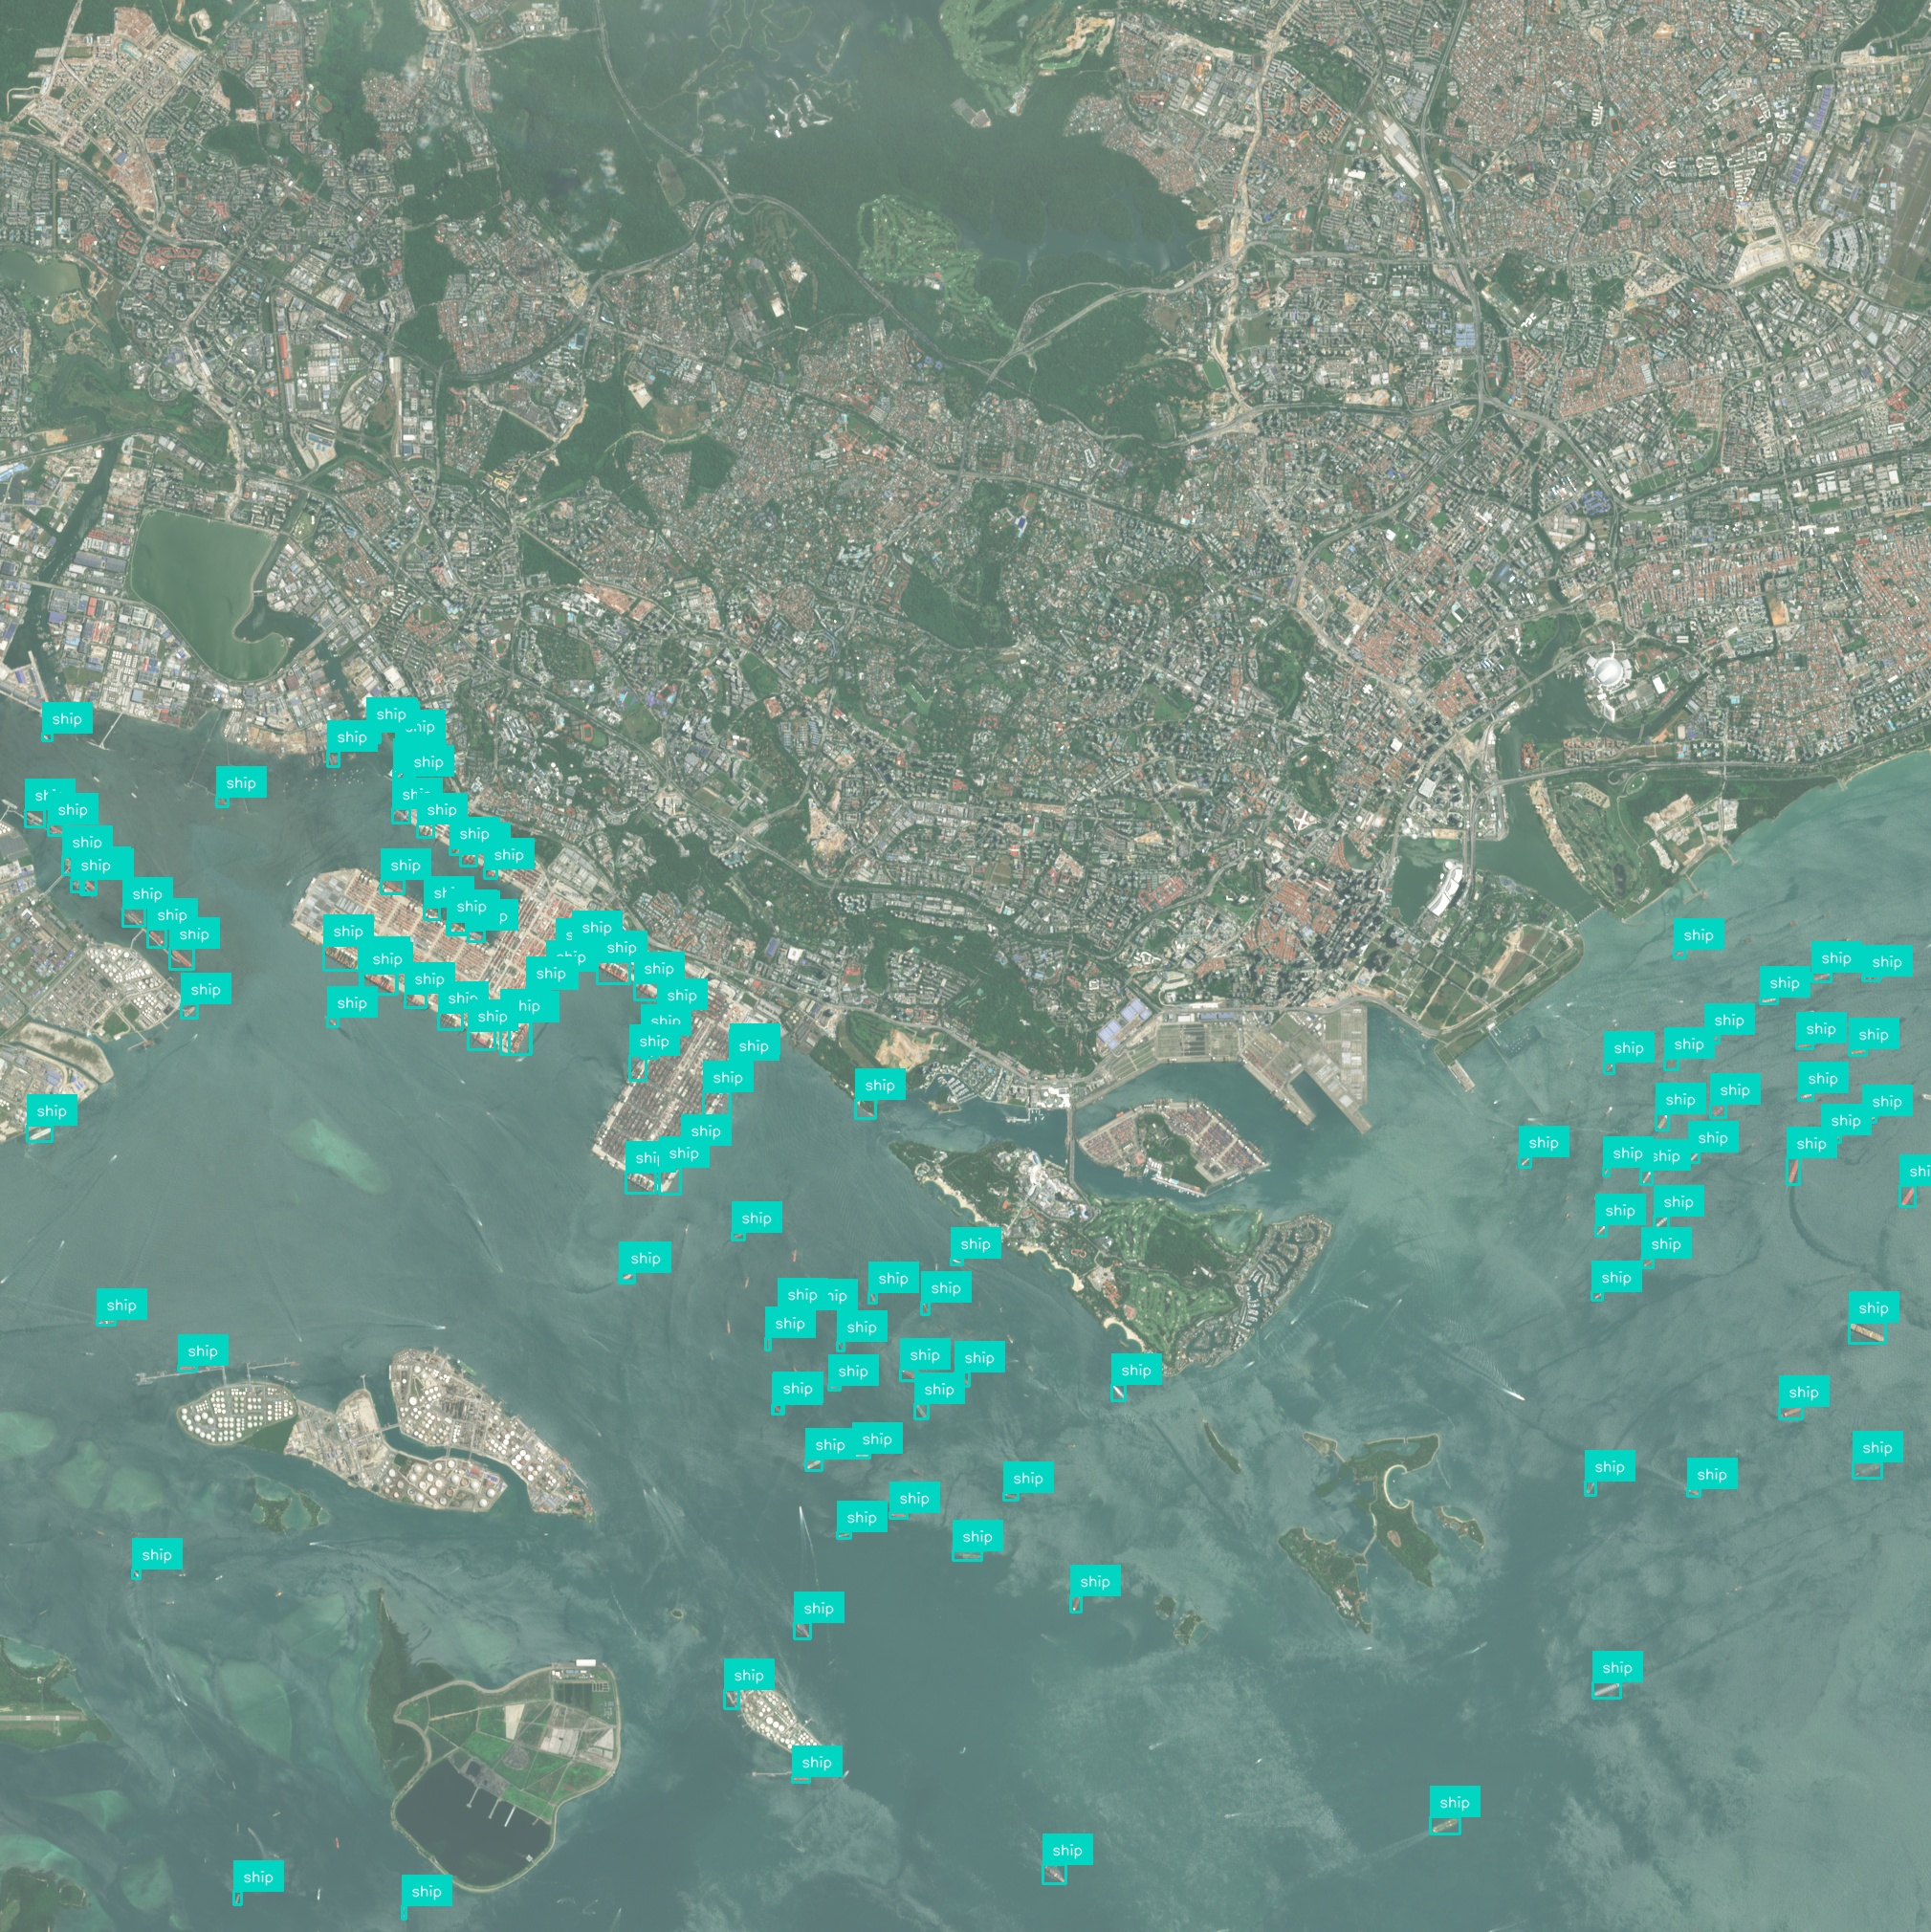
Processes imagery and sensor data across hundreds of kilometers in a unified dashboard. Scalable analytics ensure consistent monitoring of complex rail networks without manual data handling.
Targeted maintenance guided by precise deformation data minimizes unnecessary track tamping and labor costs. Optimized interventions can lower maintenance expenses by 20% annually.
APIs connect to existing asset management and GIS platforms for seamless workflow integration. Unified data access accelerates decision-making and reporting.
Have a different question and can’t find the answer you’re looking for? Reach out to our support team by sending us an email and we’ll get back to you as soon as we can.
Geospatial AI Platform
AI & foundation models
Deep-learning and foundation models turn raw imagery into ready-to-use insights, so you ship answers instead of training pipelines.
Conversational workflow
Ask questions in plain language and the platform responds with charts, visualizations, and next step suggestions.
GPU-accelerated cloud
Cloud-native architecture spins up on-demand GPU clusters that scale from a single scene to global archives—no manual ops, no bottlenecks.
Any sensor, any format
Optical, SAR, drone, IoT, vector or raster—ingest, fuse, and analyze without conversion headaches.
Insight you can see
Real-time 2D / 3D maps and export-ready plots make results clear for engineers, execs, and clients alike.
Turn satellite, drone, and sensor data into clear, real-time insights using powerful AI – no complex setup, just answers you can see and act on.