Brine Pond Tracker
Automated pond volume estimation uses satellite and sensor data for real-time lithium supply-chain insights and optimized evaporation management.
Automated pond volume estimation uses satellite and sensor data for real-time lithium supply-chain insights and optimized evaporation management.
How does it work?
Manual pond-level measurements are labor intensive and provide limited temporal resolution, hindering accurate production forecasts. Automated remote sensing and analytics deliver timely, precise volume estimates, improving supply-chain planning and risk mitigation.
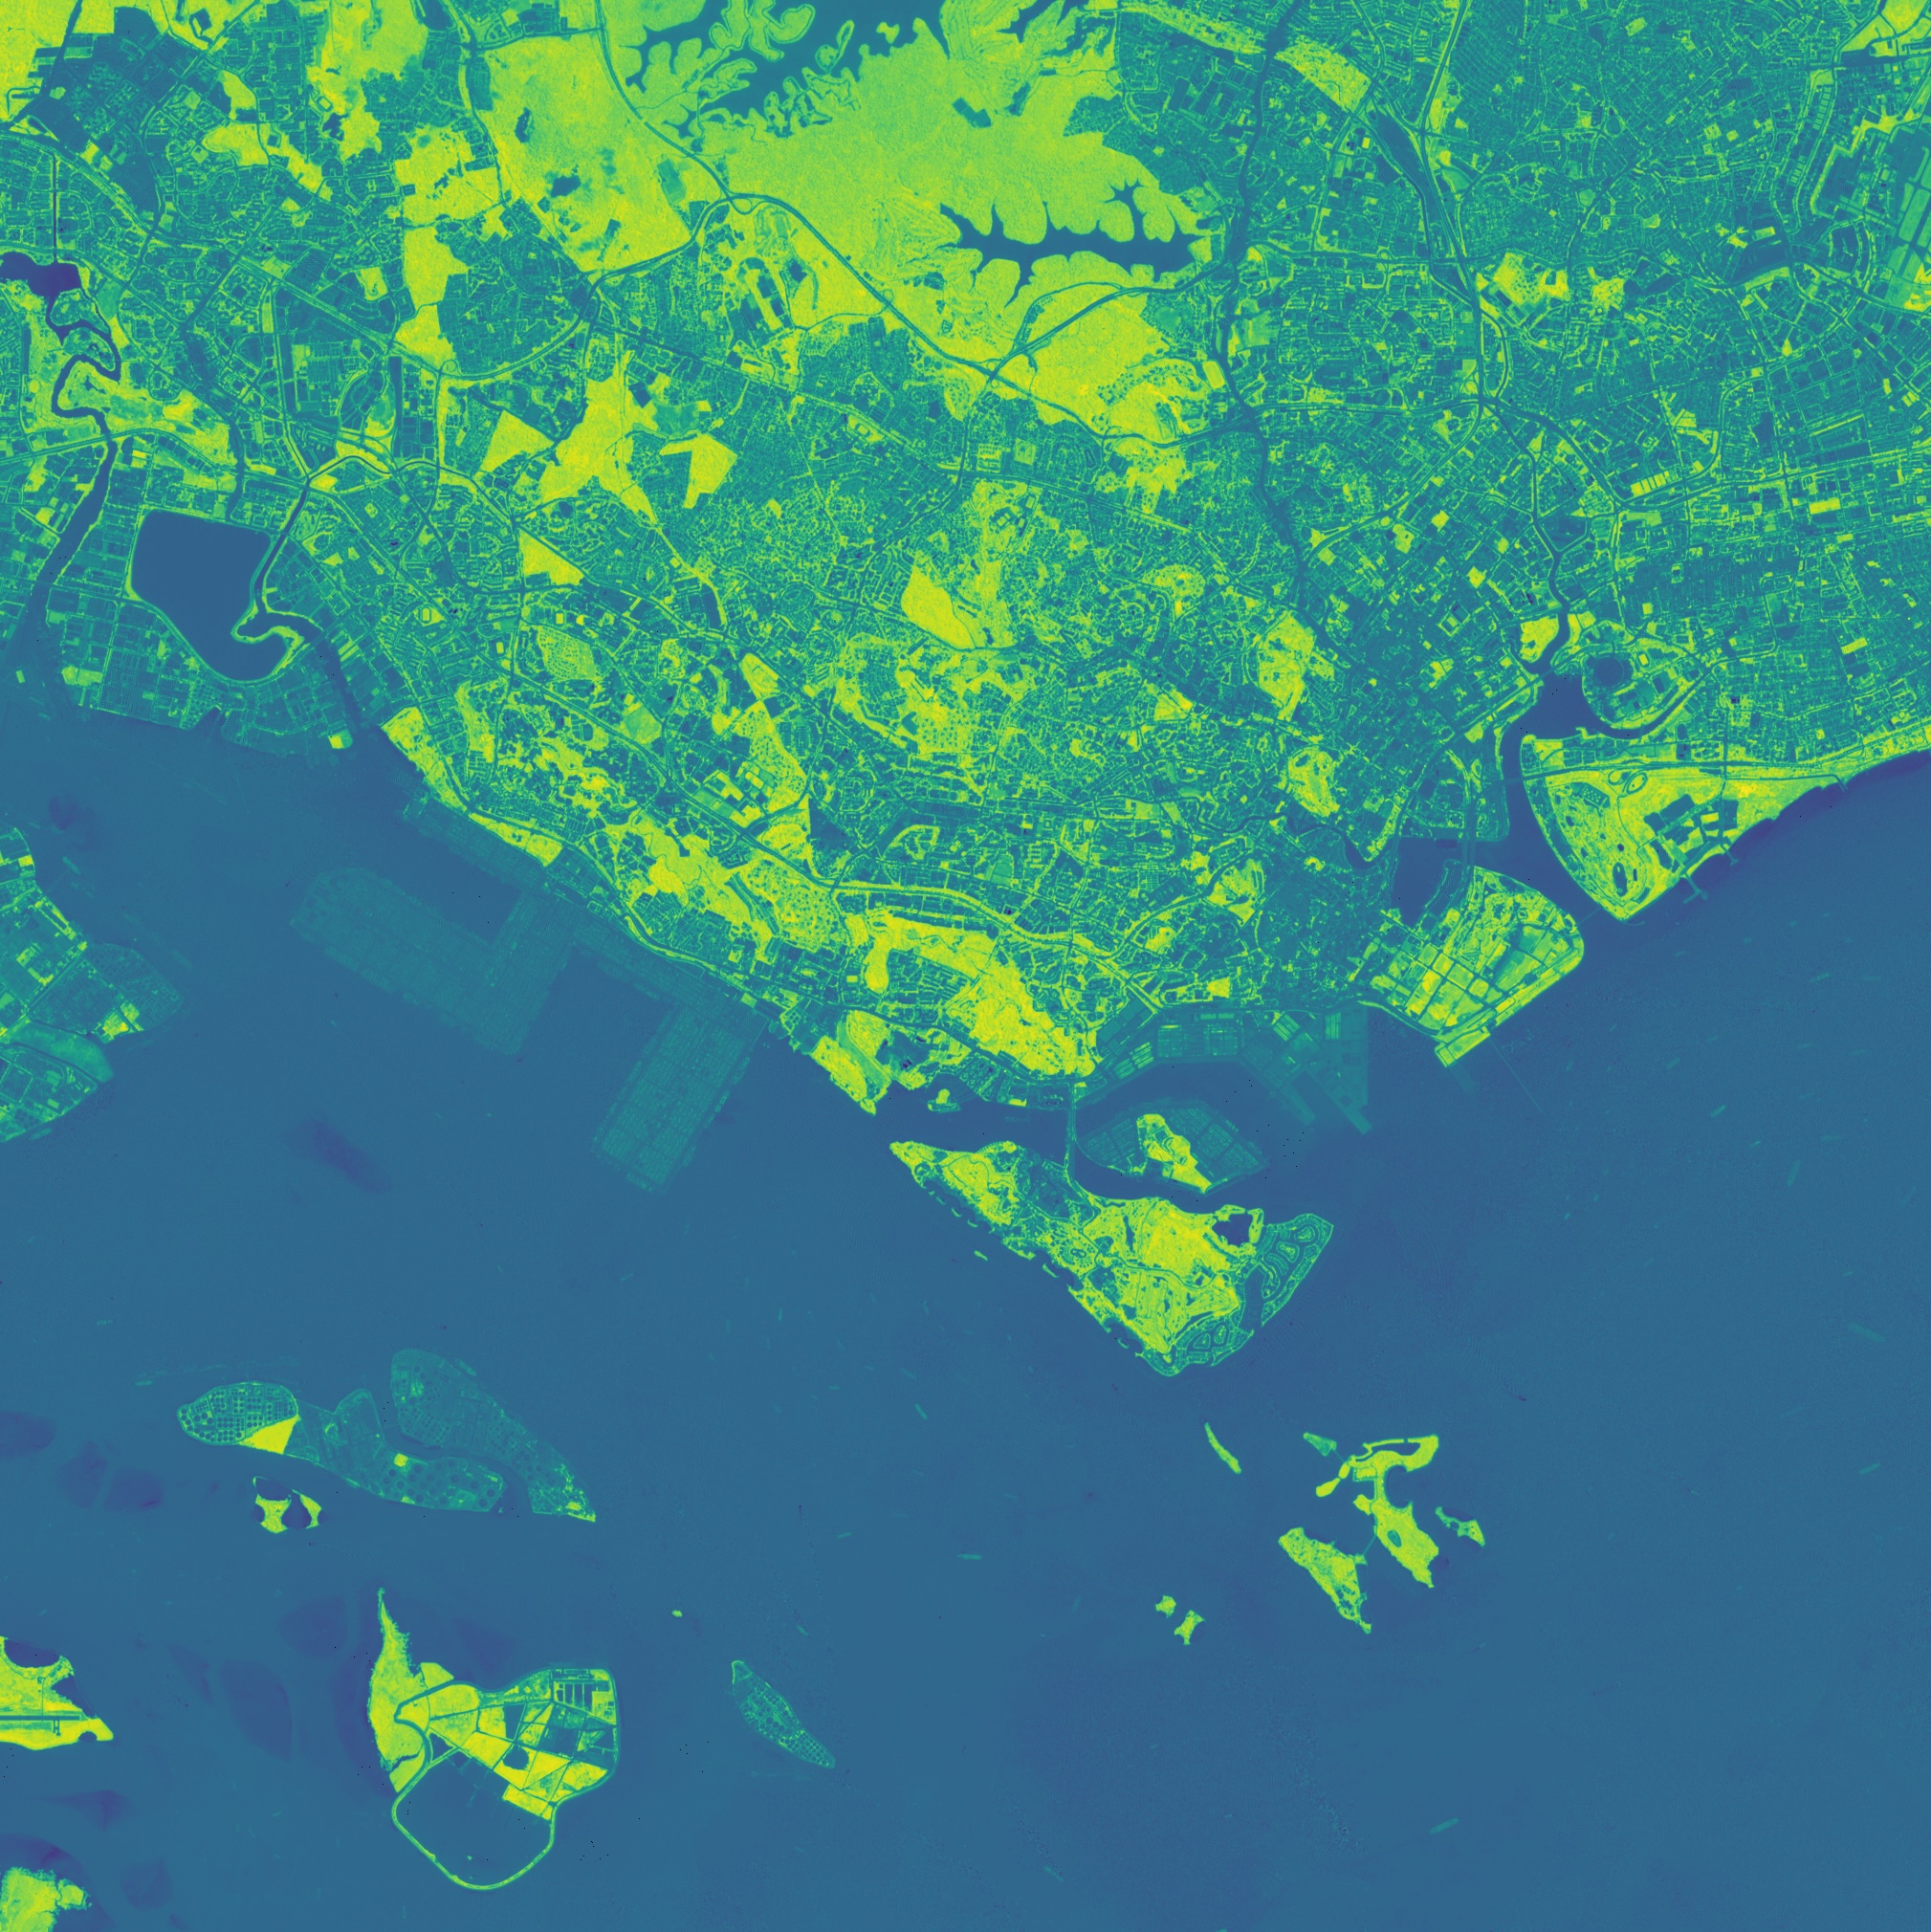
Multispectral satellite imagery and photogrammetry generate precise pond depth and surface area metrics. This reduces estimation errors by up to 20% compared to traditional manual surveys.
Daily or sub-daily data updates enable continuous tracking of evaporation rates and volume changes. Instant alerts highlight deviations from expected trends to inform rapid operational adjustments.
Historical volume trends and weather data feed predictive models for lithium output forecasting. This supports procurement teams in aligning feedstock availability with battery production schedules.
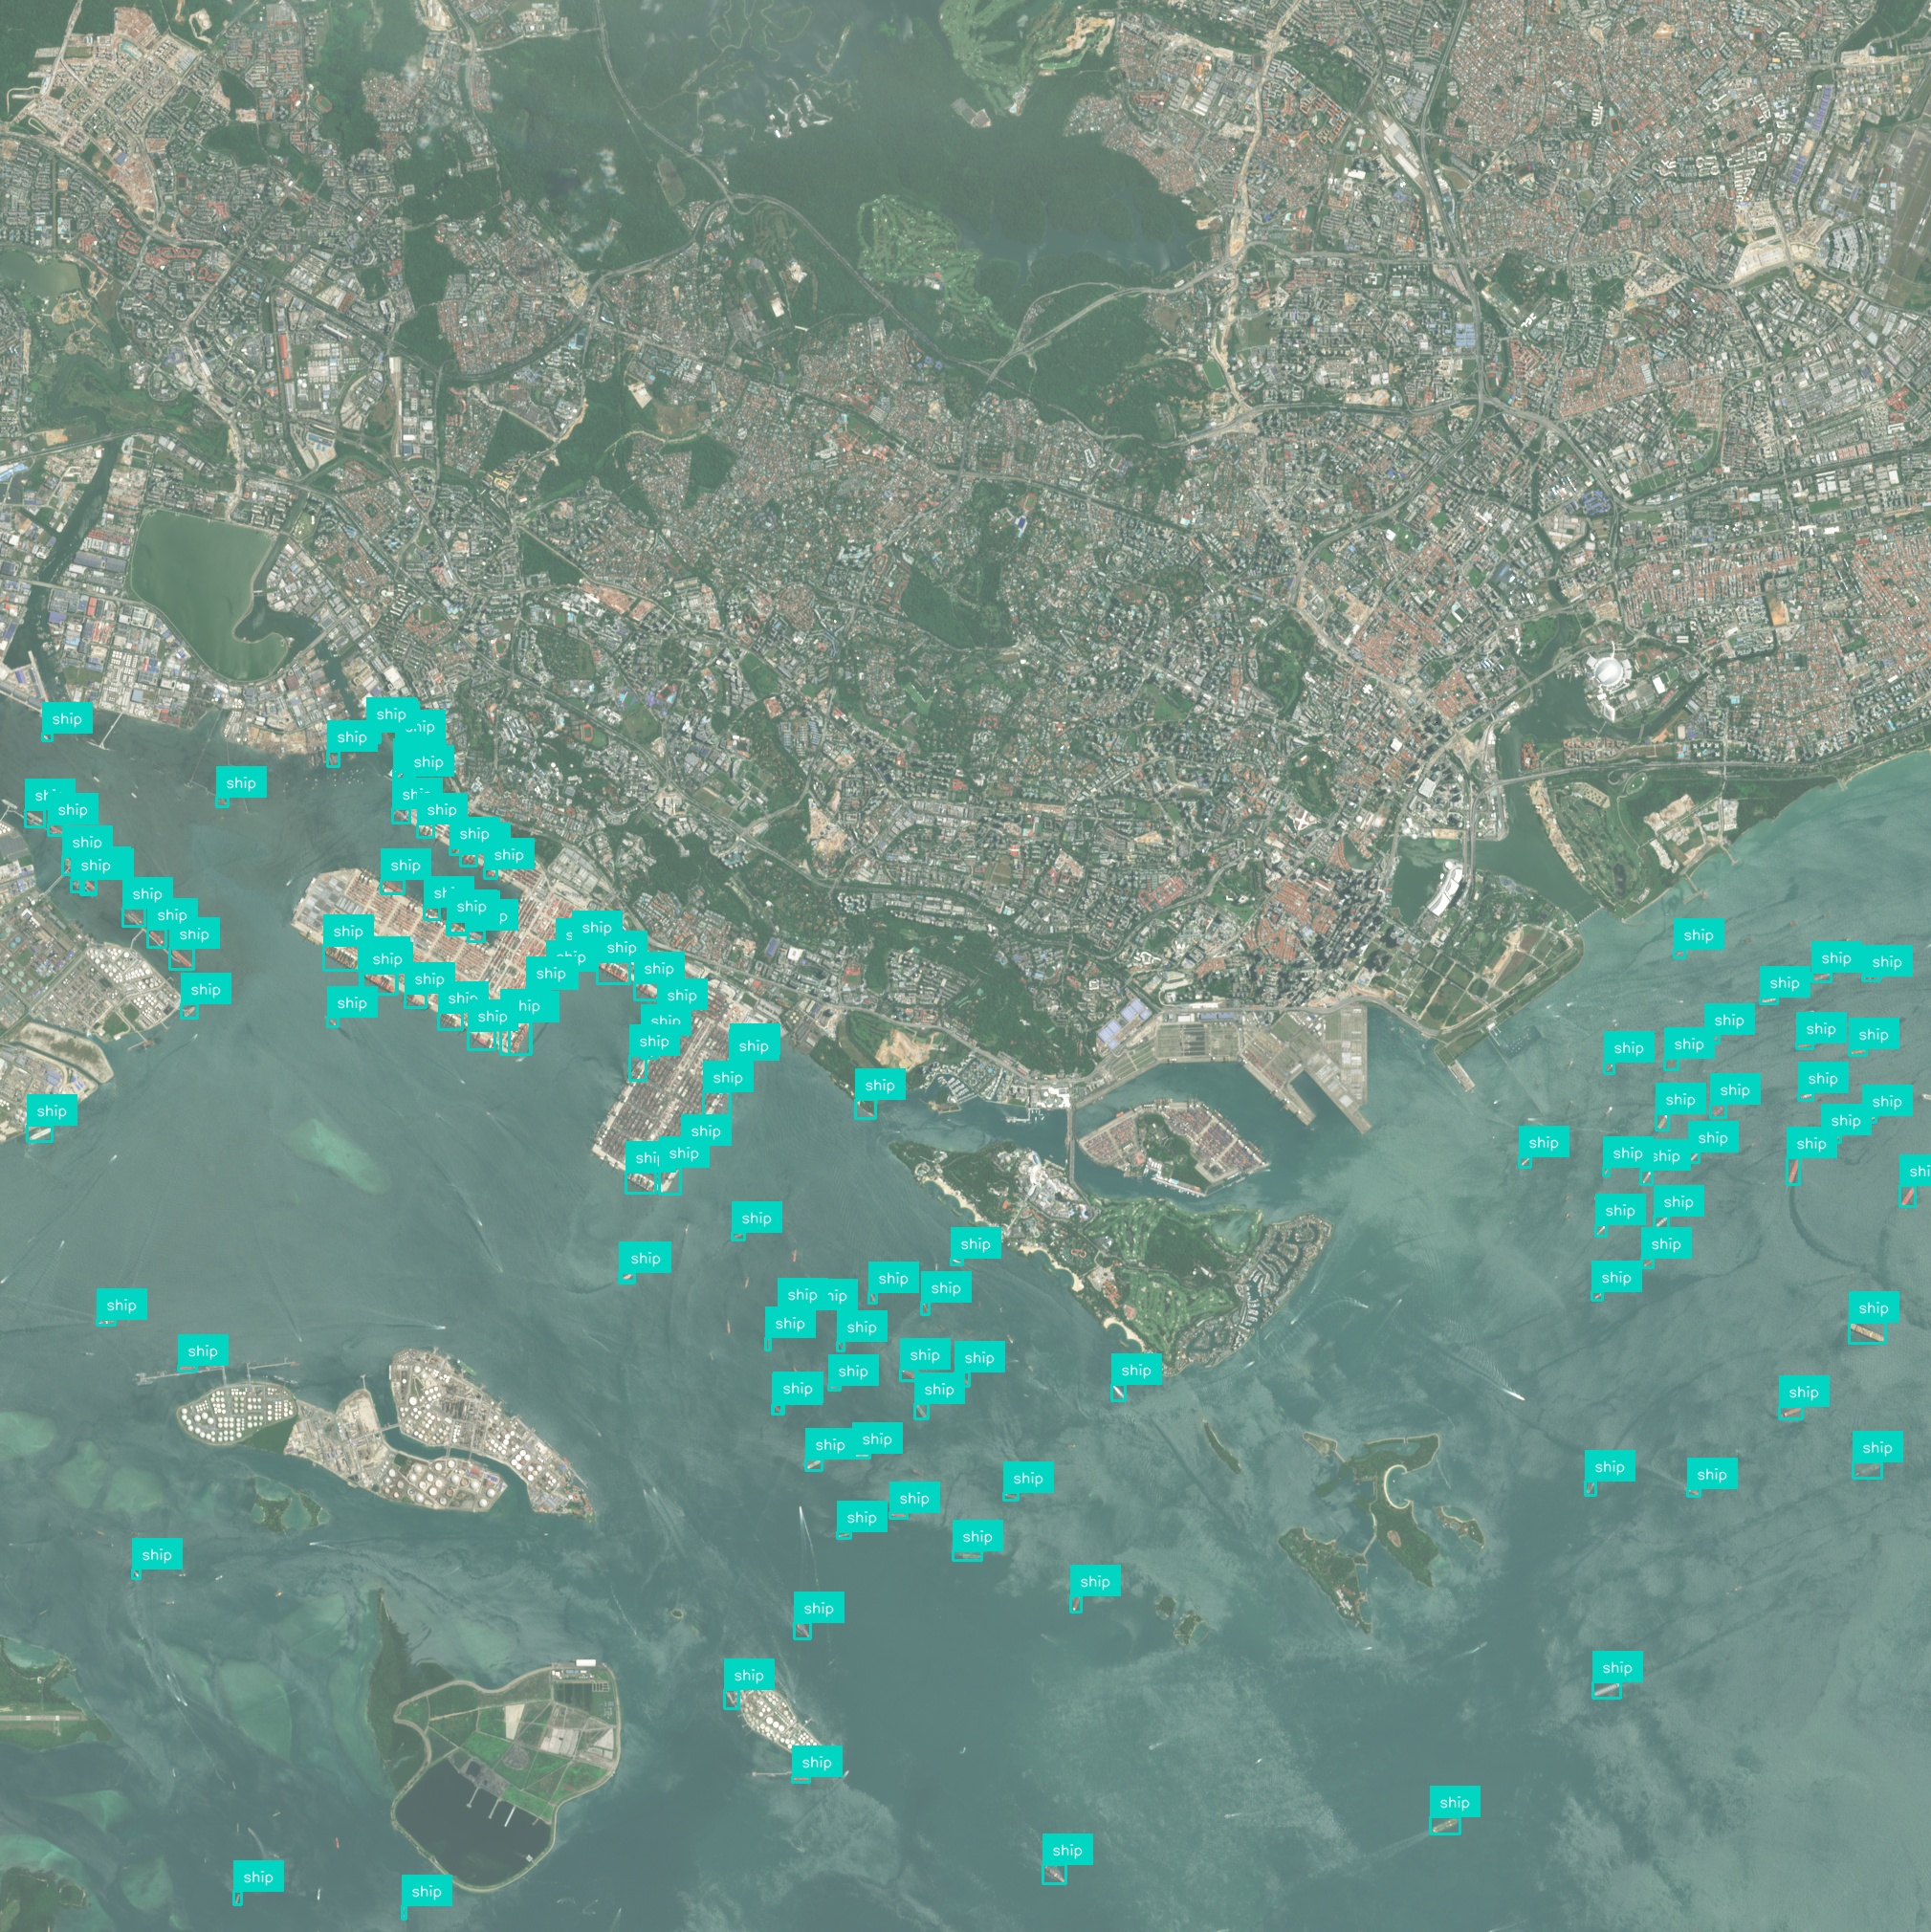
Early detection of abnormal pond drainage or leakage prevents environmental and production incidents. Geospatial analytics flag anomalies, helping engineers intervene before costly shutdowns occur.
Integrating analytics with pumping and brine distribution systems automates refill and concentration controls. Optimized schedules reduce energy use and increase overall evaporation efficiency by up to 15%.
Automated volume logs and geolocated imagery simplify reporting to regulators and investors. Timestamped records ensure audit-ready documentation for environmental monitoring requirements.
Have a different question and can’t find the answer you’re looking for? Reach out to our support team by sending us an email and we’ll get back to you as soon as we can.
Geospatial AI Platform
AI & foundation models
Deep-learning and foundation models turn raw imagery into ready-to-use insights, so you ship answers instead of training pipelines.
Conversational workflow
Ask questions in plain language and the platform responds with charts, visualizations, and next step suggestions.
GPU-accelerated cloud
Cloud-native architecture spins up on-demand GPU clusters that scale from a single scene to global archives—no manual ops, no bottlenecks.
Any sensor, any format
Optical, SAR, drone, IoT, vector or raster—ingest, fuse, and analyze without conversion headaches.
Insight you can see
Real-time 2D / 3D maps and export-ready plots make results clear for engineers, execs, and clients alike.
Turn satellite, drone, and sensor data into clear, real-time insights using powerful AI – no complex setup, just answers you can see and act on.