Risk Map Insights
Combines flood, wildfire, and storm hazard layers with building data and historical claims to produce granular risk scores for properties.
Combines flood, wildfire, and storm hazard layers with building data and historical claims to produce granular risk scores for properties.
How does it work?
Insurers struggle to assess multi-hazard exposure at property level using siloed data sources, leading to underwriting uncertainty. This AI-driven geospatial platform integrates diverse hazard models and property attributes to deliver precise risk maps, enhancing portfolio management and pricing accuracy.
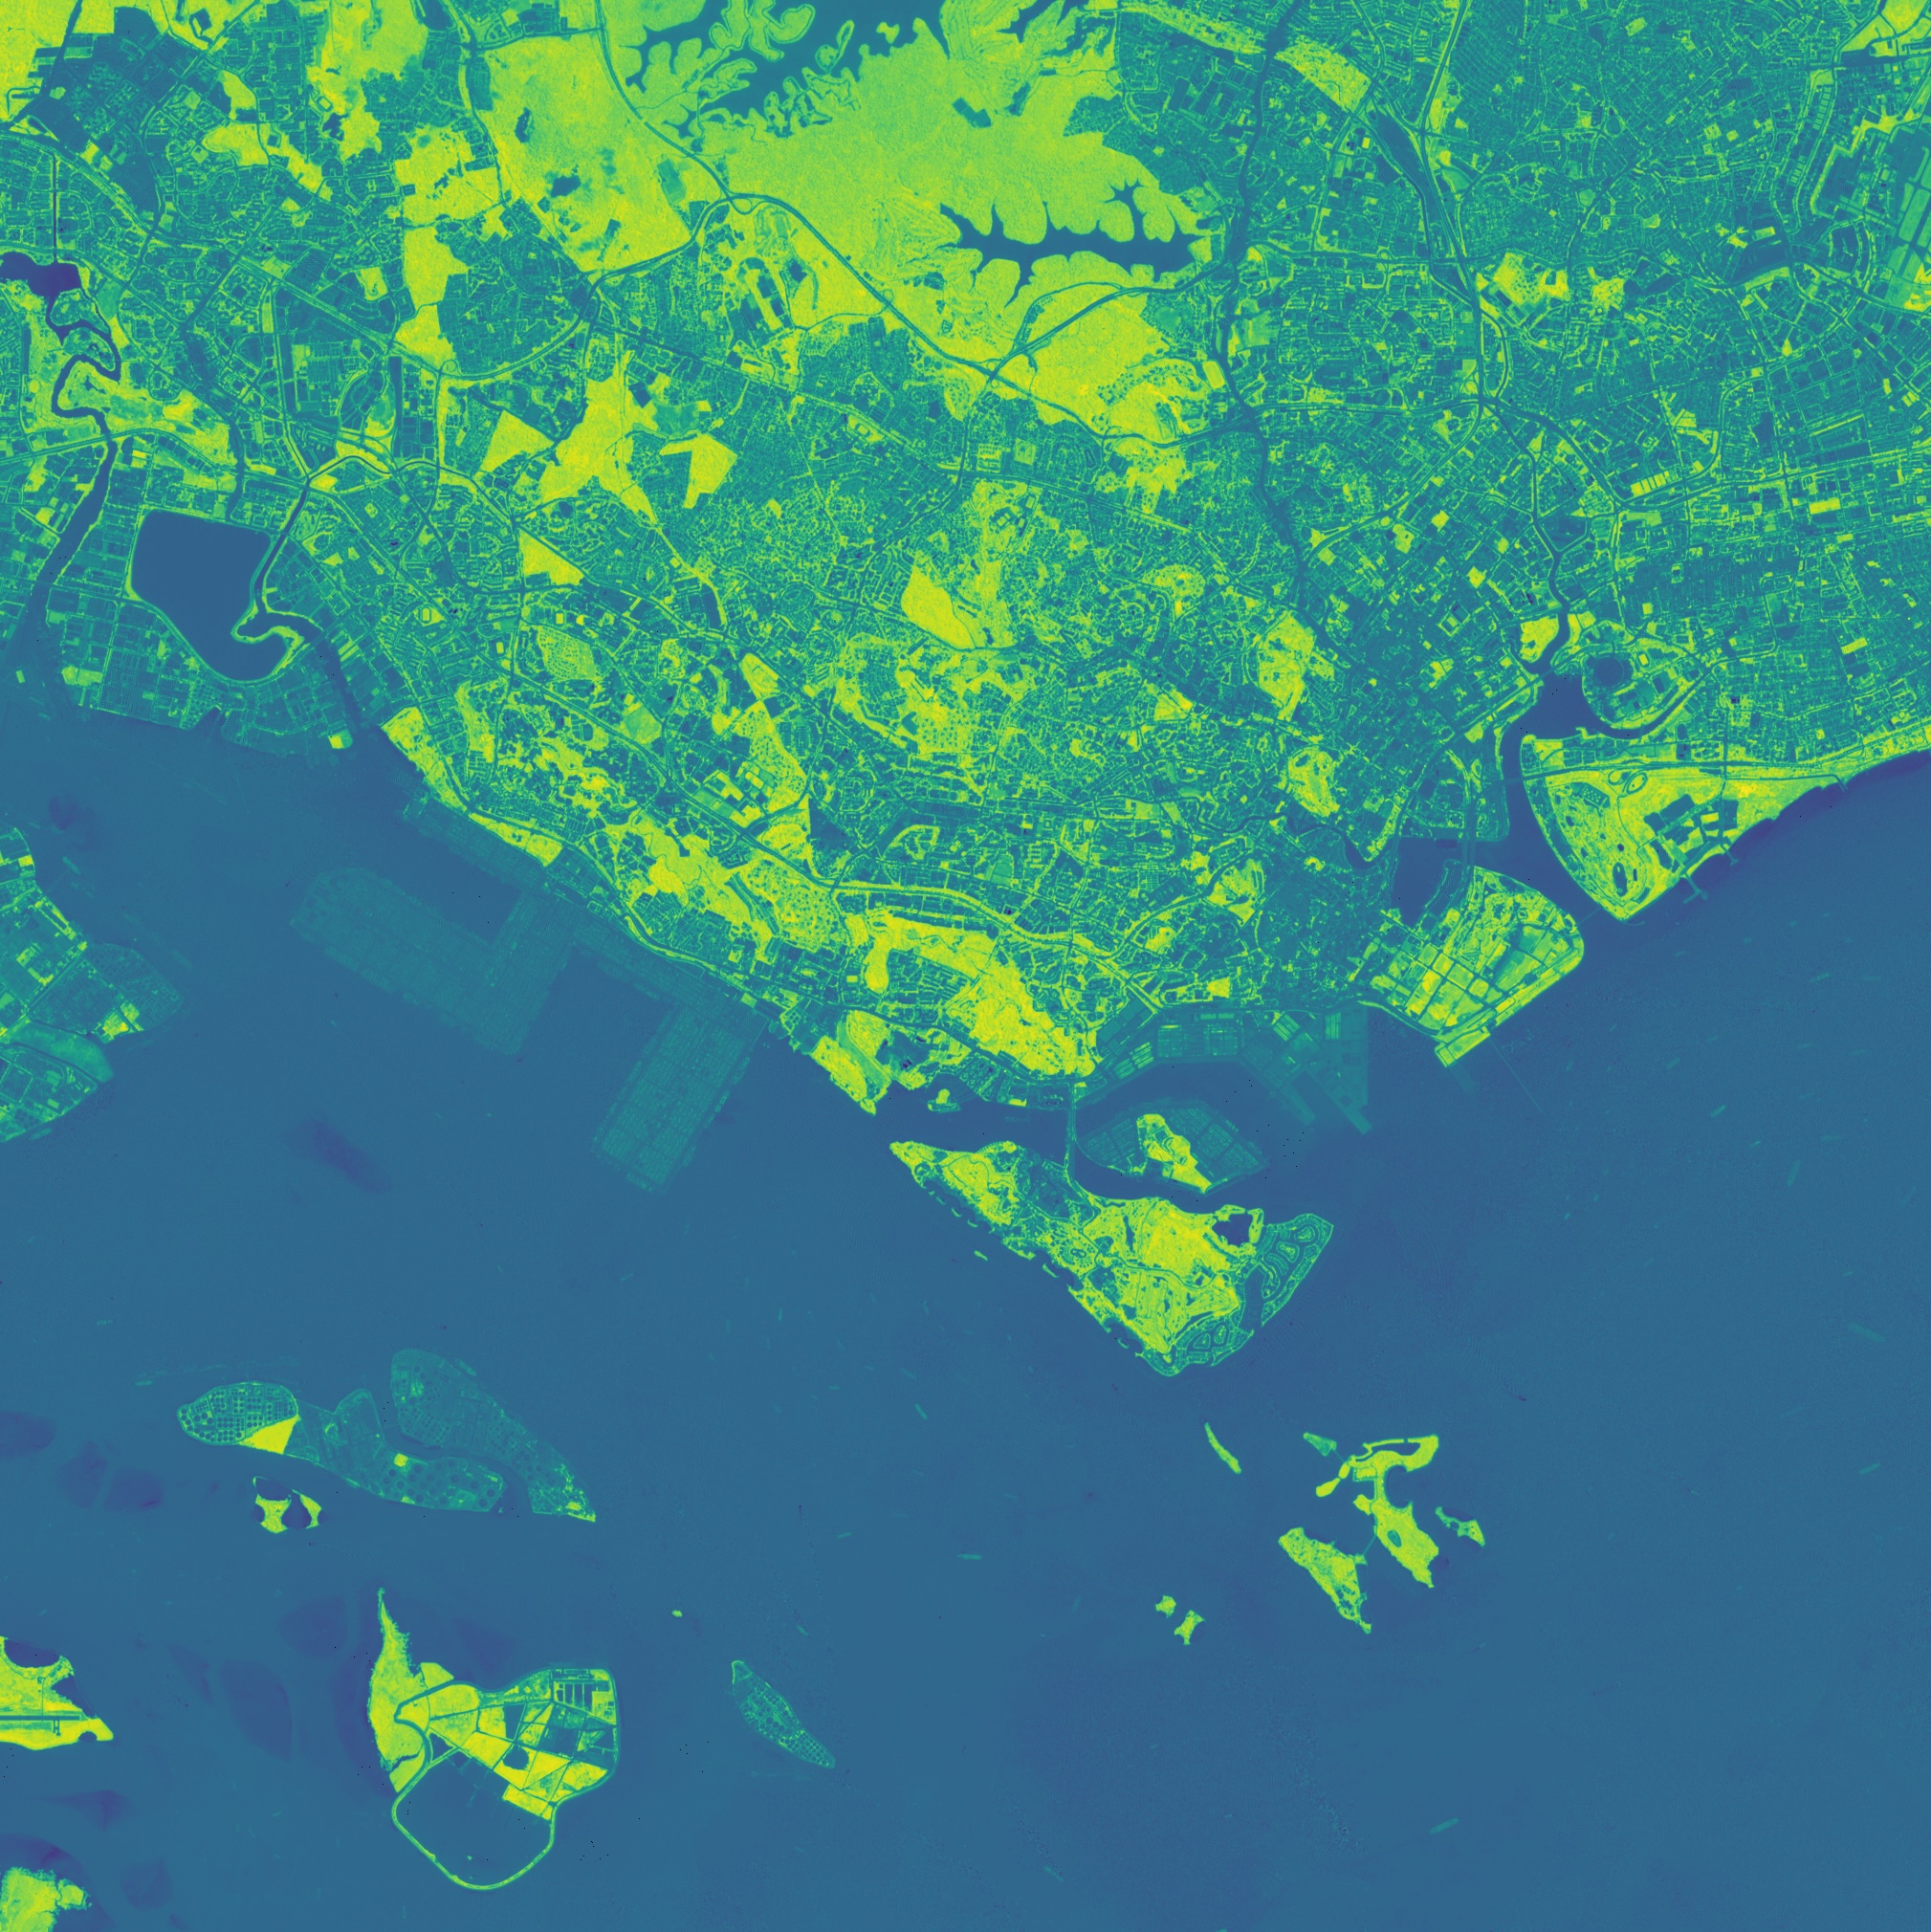
Integrates flood, wildfire, hurricane, and earthquake data into a unified hazard map. This holistic view reveals overlapping exposures often missed by single-hazard approaches.
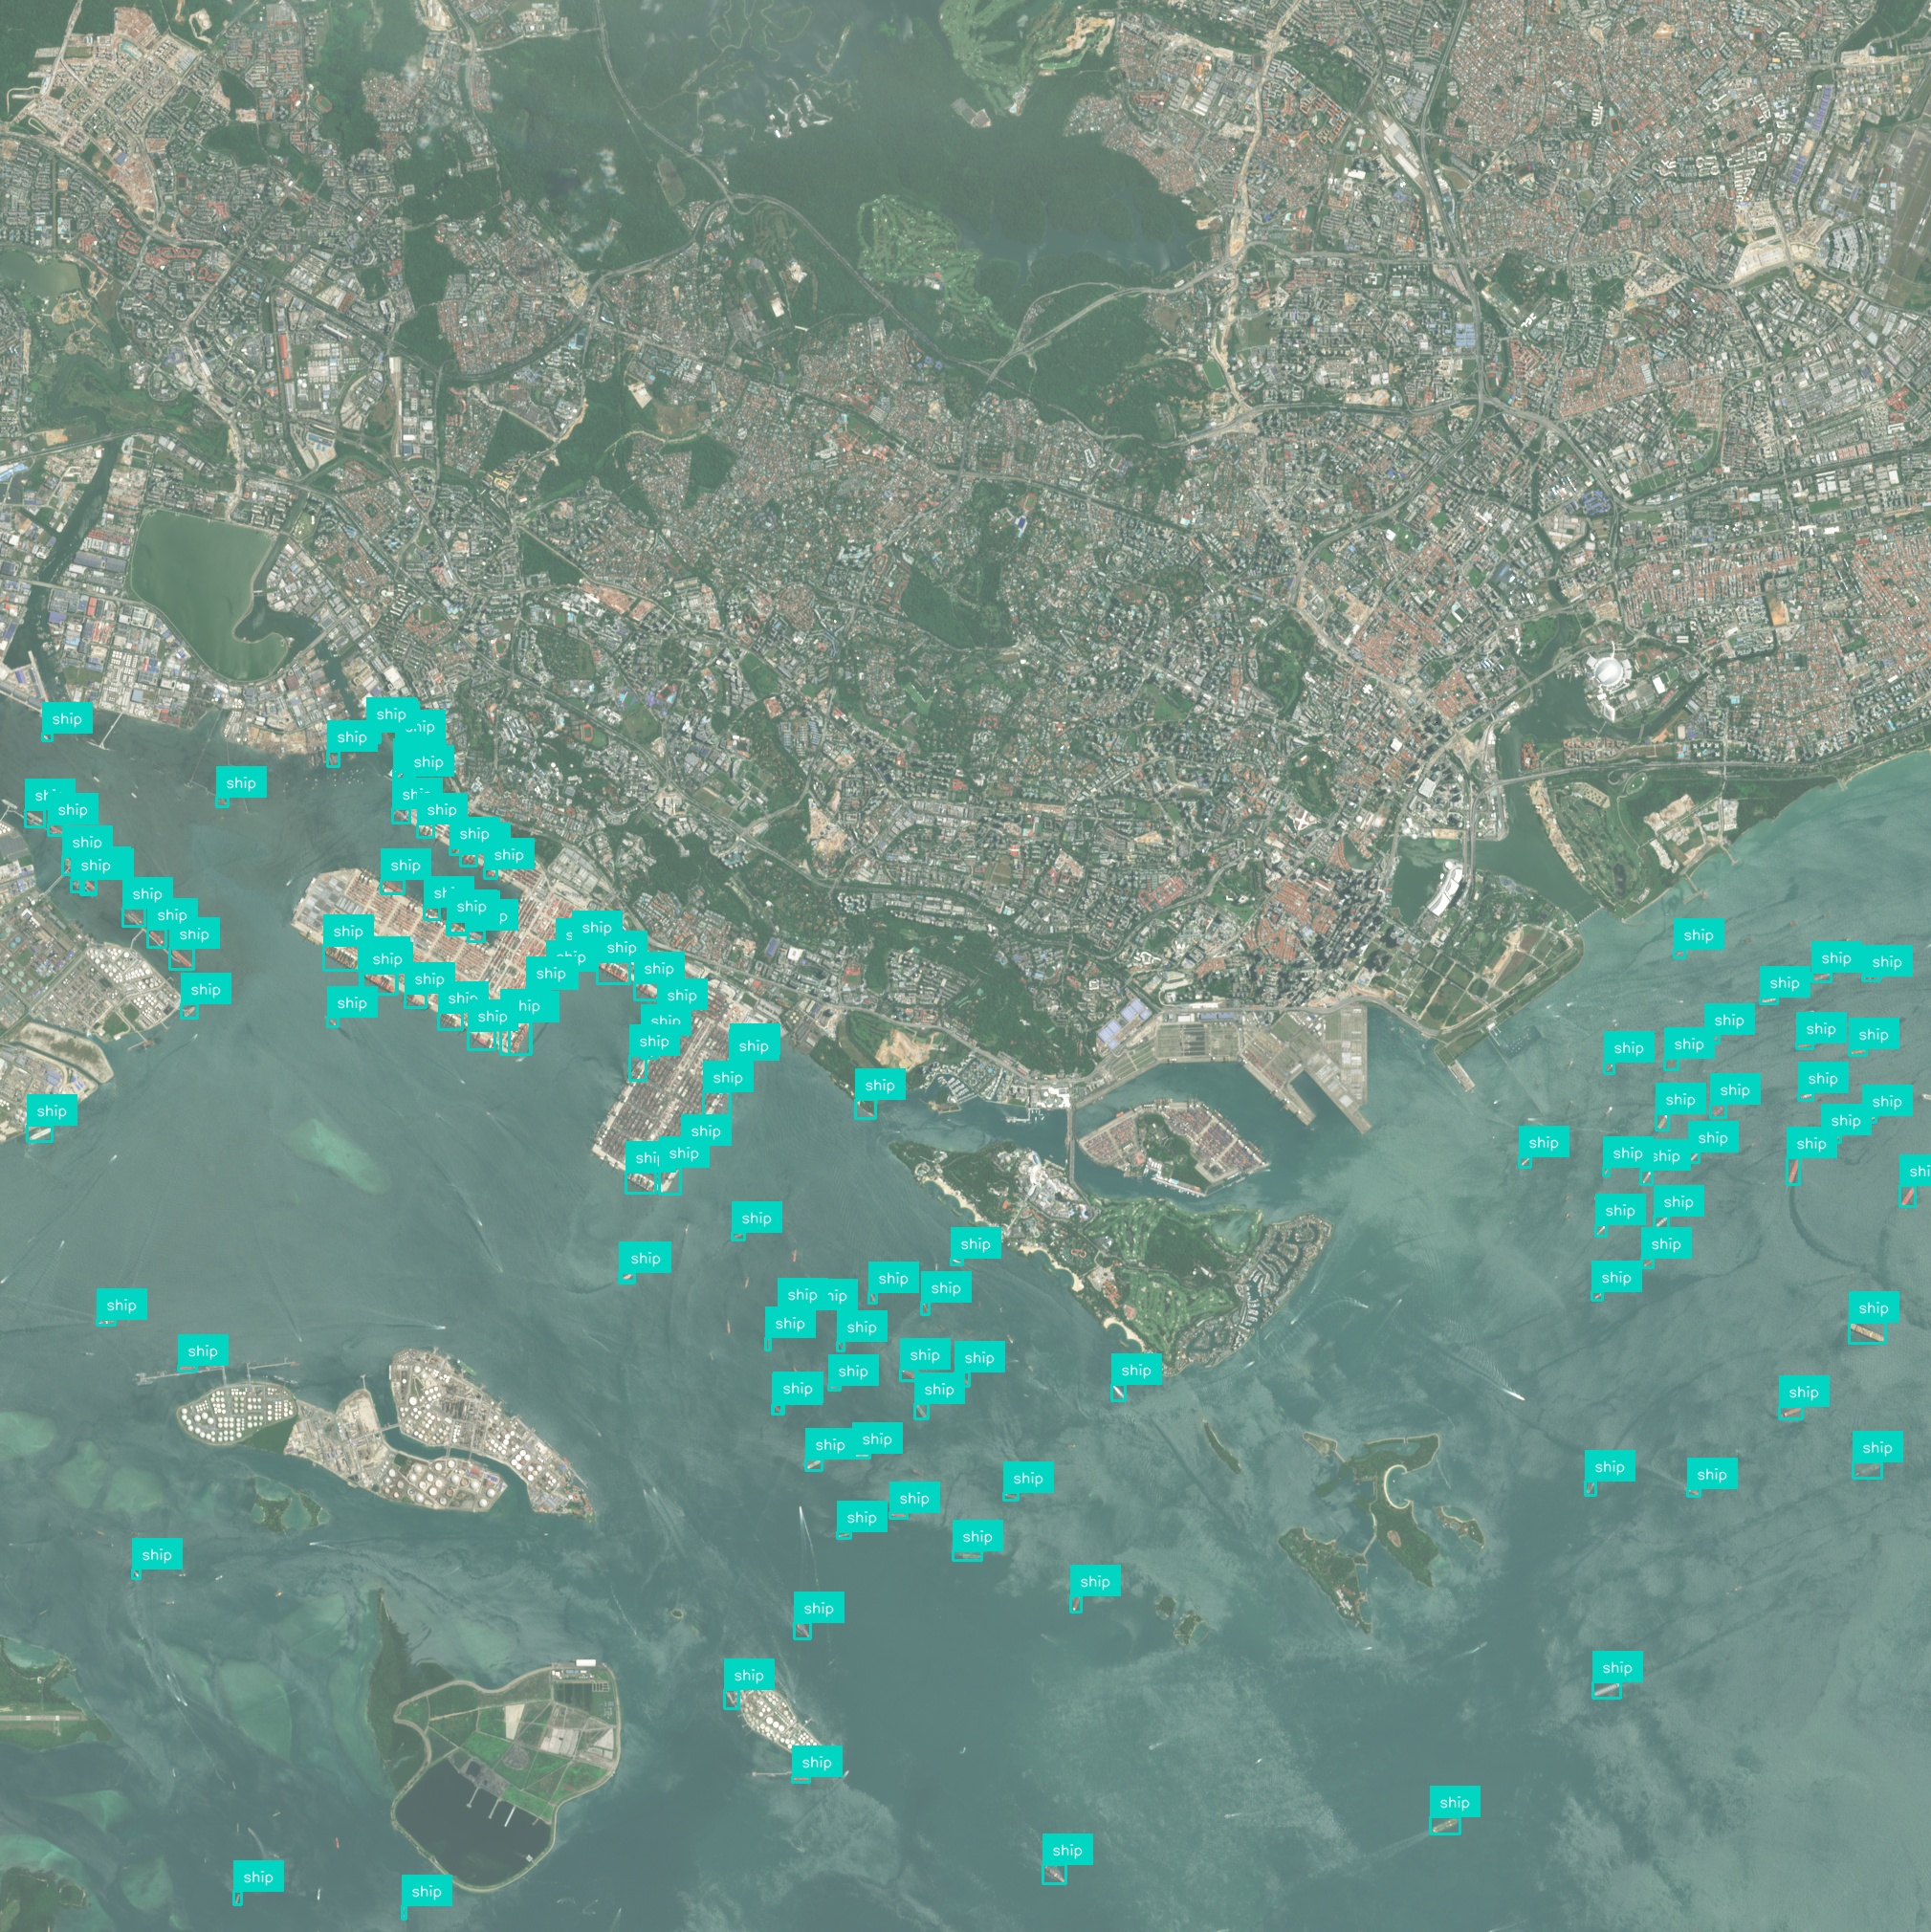
Generates property-level risk metrics down to parcel resolution. These scores enable underwriters to differentiate policies based on precise localized risk.
Incorporates past loss records and claims data to calibrate risk models. This improves predictive accuracy by aligning hazard projections with real-world outcomes.
Simulates future scenarios under climate change and land use changes with AI-driven algorithms. Underwriters can test risk impacts under varying assumptions quickly.
Visualizes entire insurance portfolios on interactive maps with filterable risk categories. This aids risk aggregation analysis and capital allocation decisions.
Ensures risk assessments meet regional and international reporting standards like Solvency II or NAIC. Automated data exports streamline regulatory submissions.
Have a different question and can’t find the answer you’re looking for? Reach out to our support team by sending us an email and we’ll get back to you as soon as we can.
Geospatial AI Platform
AI & foundation models
Deep-learning and foundation models turn raw imagery into ready-to-use insights, so you ship answers instead of training pipelines.
Conversational workflow
Ask questions in plain language and the platform responds with charts, visualizations, and next step suggestions.
GPU-accelerated cloud
Cloud-native architecture spins up on-demand GPU clusters that scale from a single scene to global archives—no manual ops, no bottlenecks.
Any sensor, any format
Optical, SAR, drone, IoT, vector or raster—ingest, fuse, and analyze without conversion headaches.
Insight you can see
Real-time 2D / 3D maps and export-ready plots make results clear for engineers, execs, and clients alike.
Turn satellite, drone, and sensor data into clear, real-time insights using powerful AI – no complex setup, just answers you can see and act on.