Hazard Risk Scan
Aerial and GIS analytics map flood, wildfire, and contamination hazards around properties to support precise risk assessments and mitigation planning.
Aerial and GIS analytics map flood, wildfire, and contamination hazards around properties to support precise risk assessments and mitigation planning.
How does it work?
Traditional property due diligence relies on static records and site inspections that often miss emerging environmental threats. Dynamic hazards like floods, wildfires, and pollution require timely, data-driven insights to accurately quantify risk and guide protective measures.
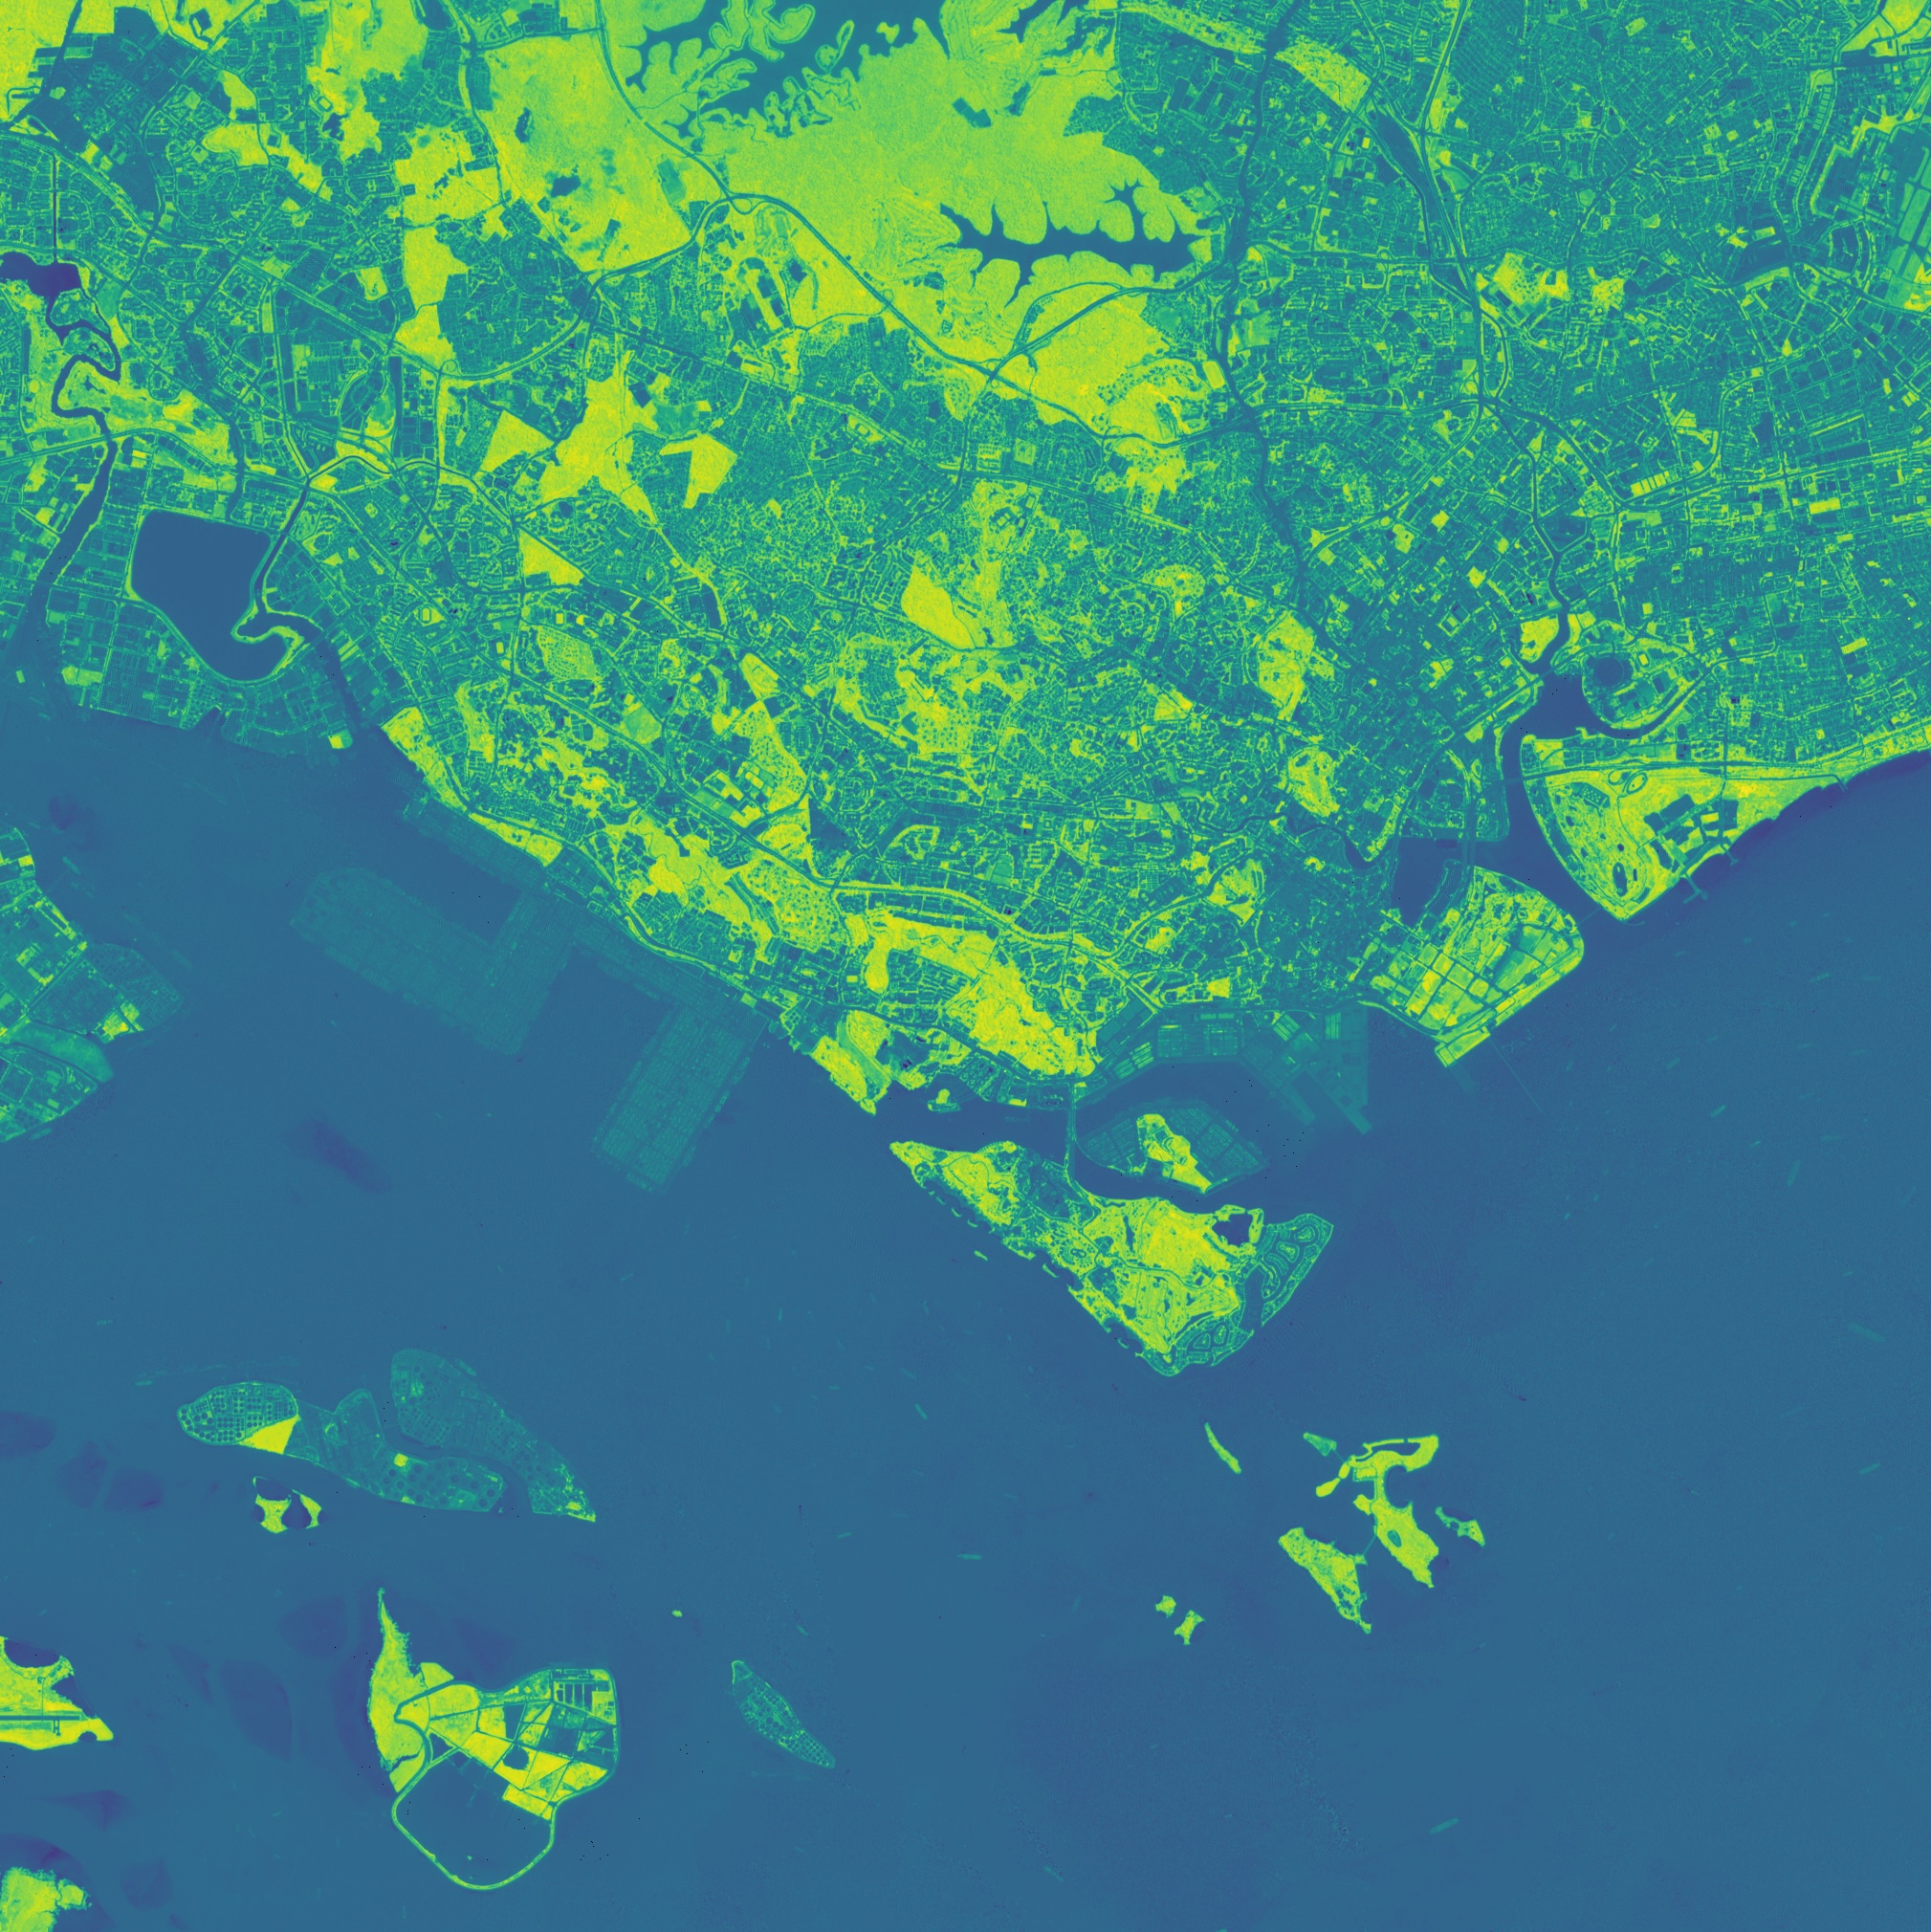
High-resolution elevation and hydrological models identify flood-prone zones around each property. This enables targeted mitigation like drainage design or elevation adjustments to reduce flood damage.
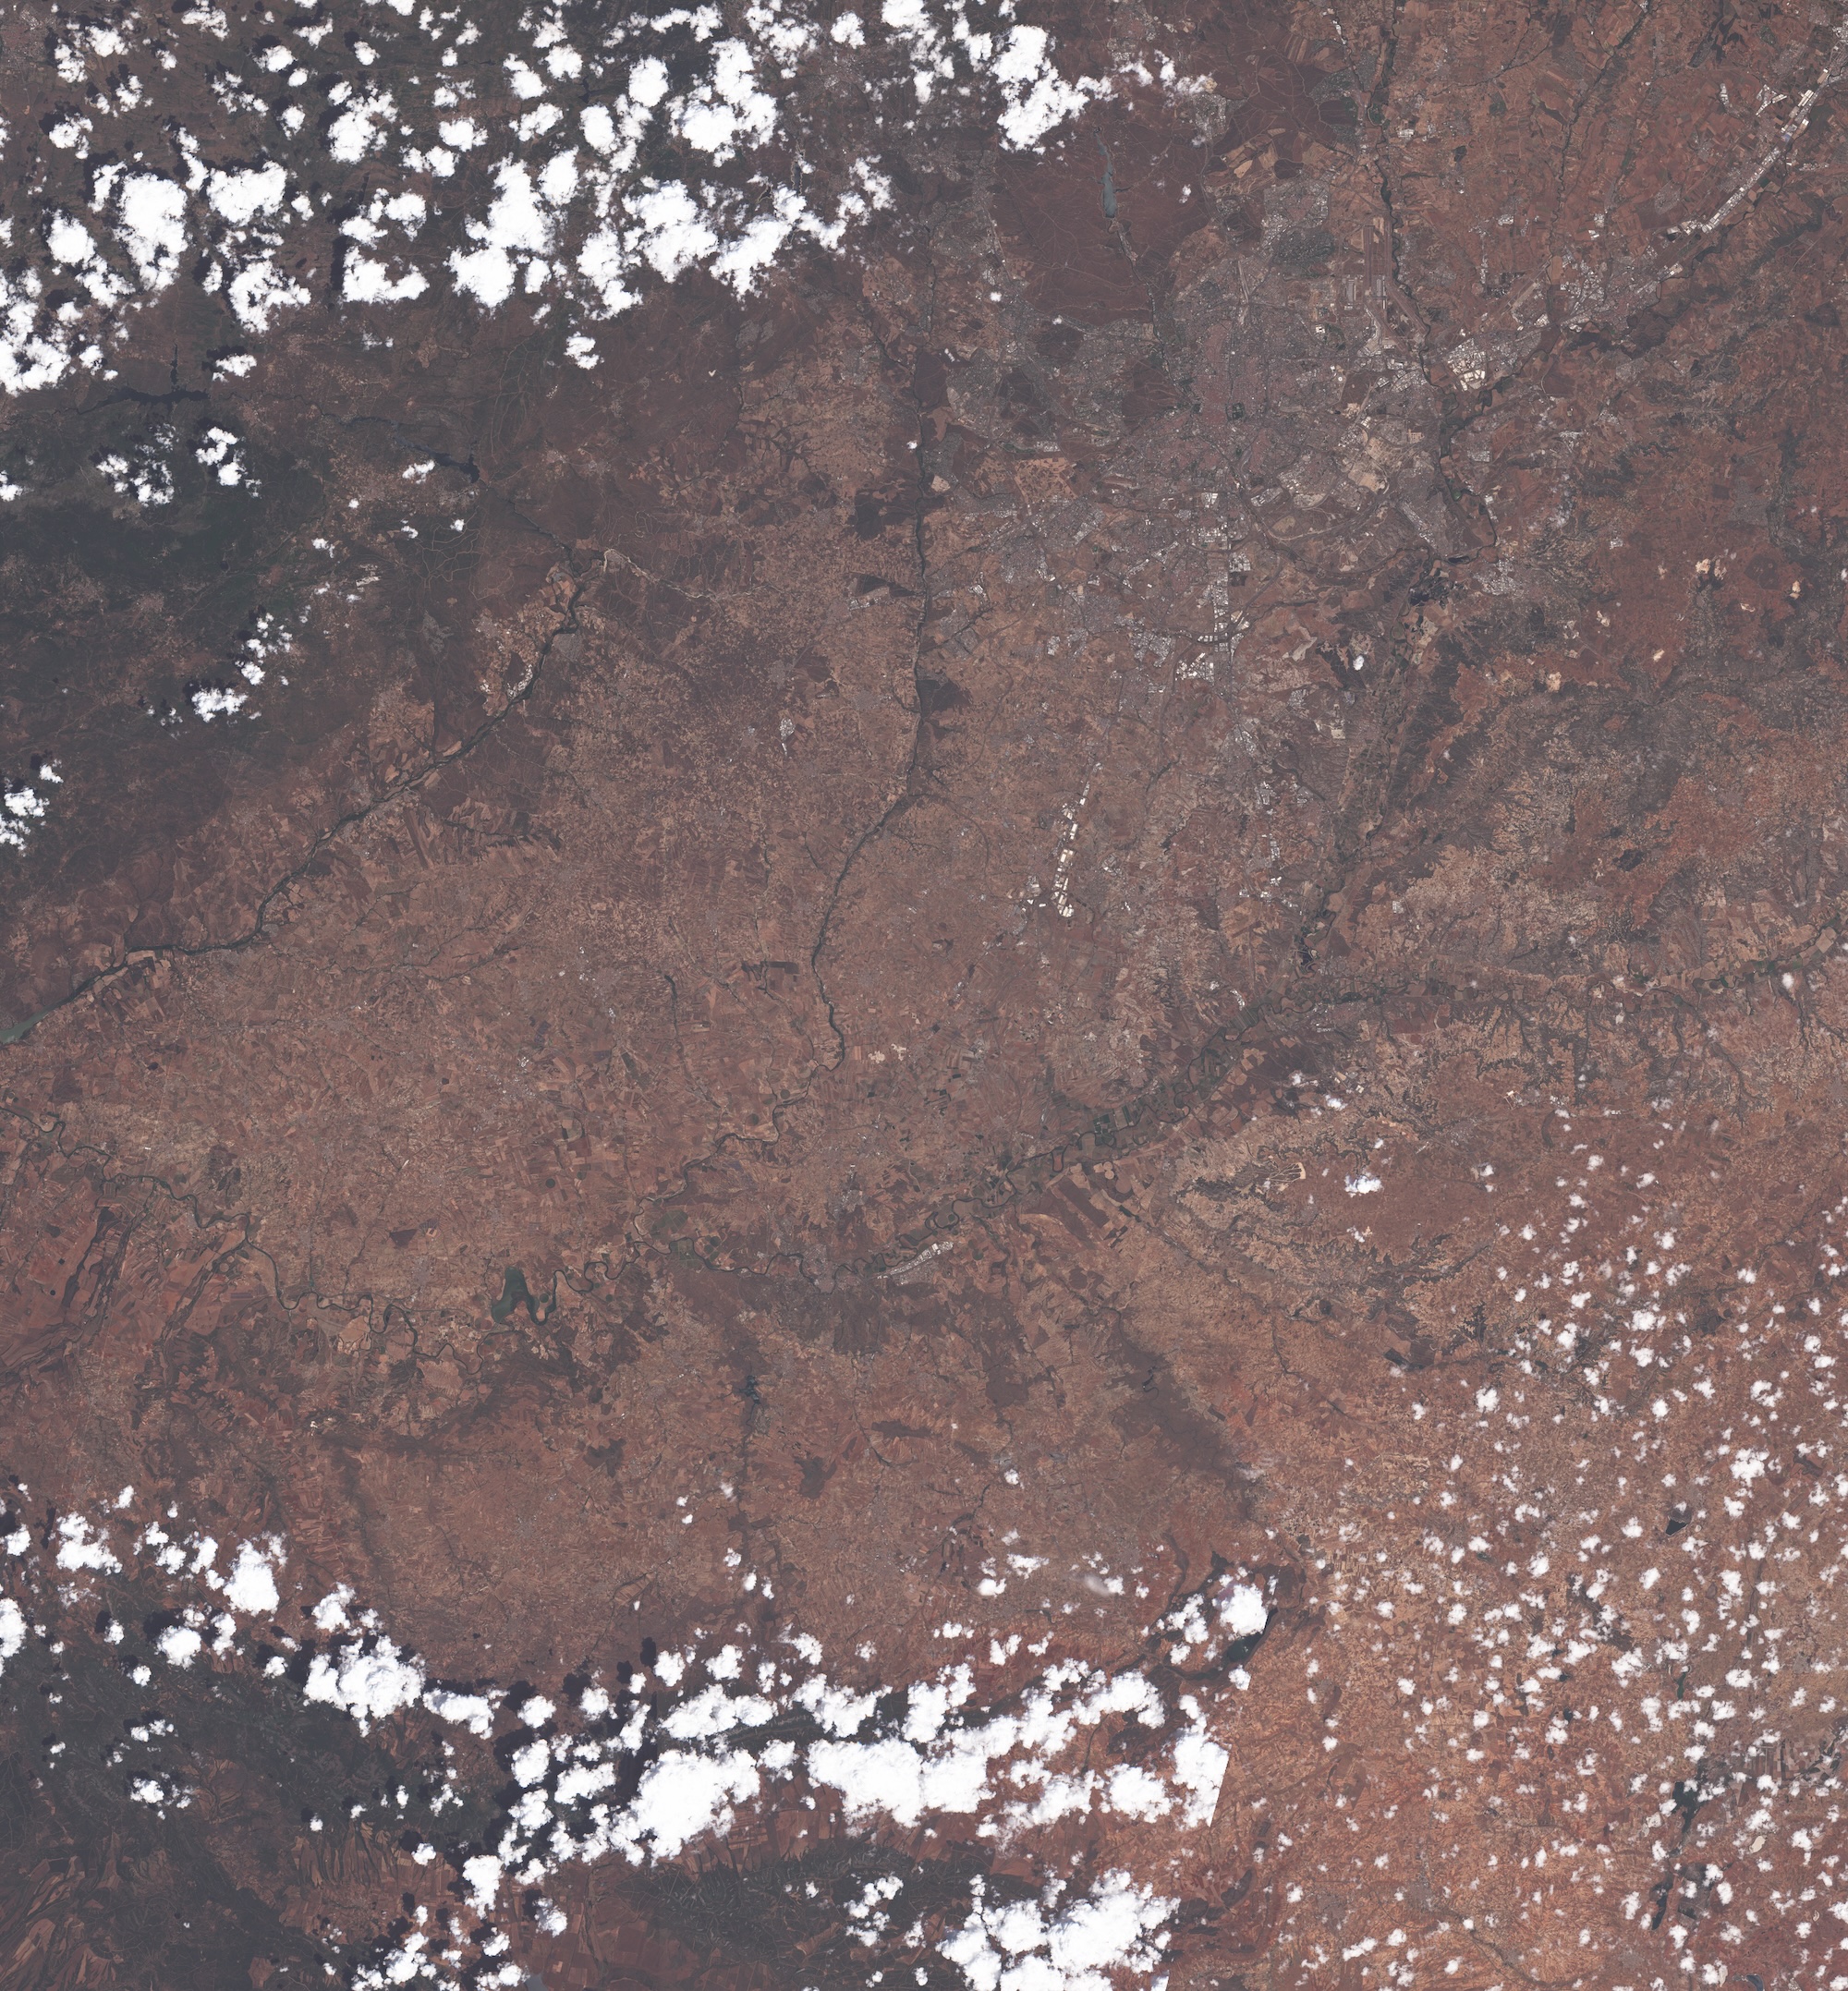
Satellite-derived vegetation and historical fire data quantify wildfire likelihood and potential impact areas. Property owners can plan defensible space and fire-resistant landscaping armed with precise exposure metrics.
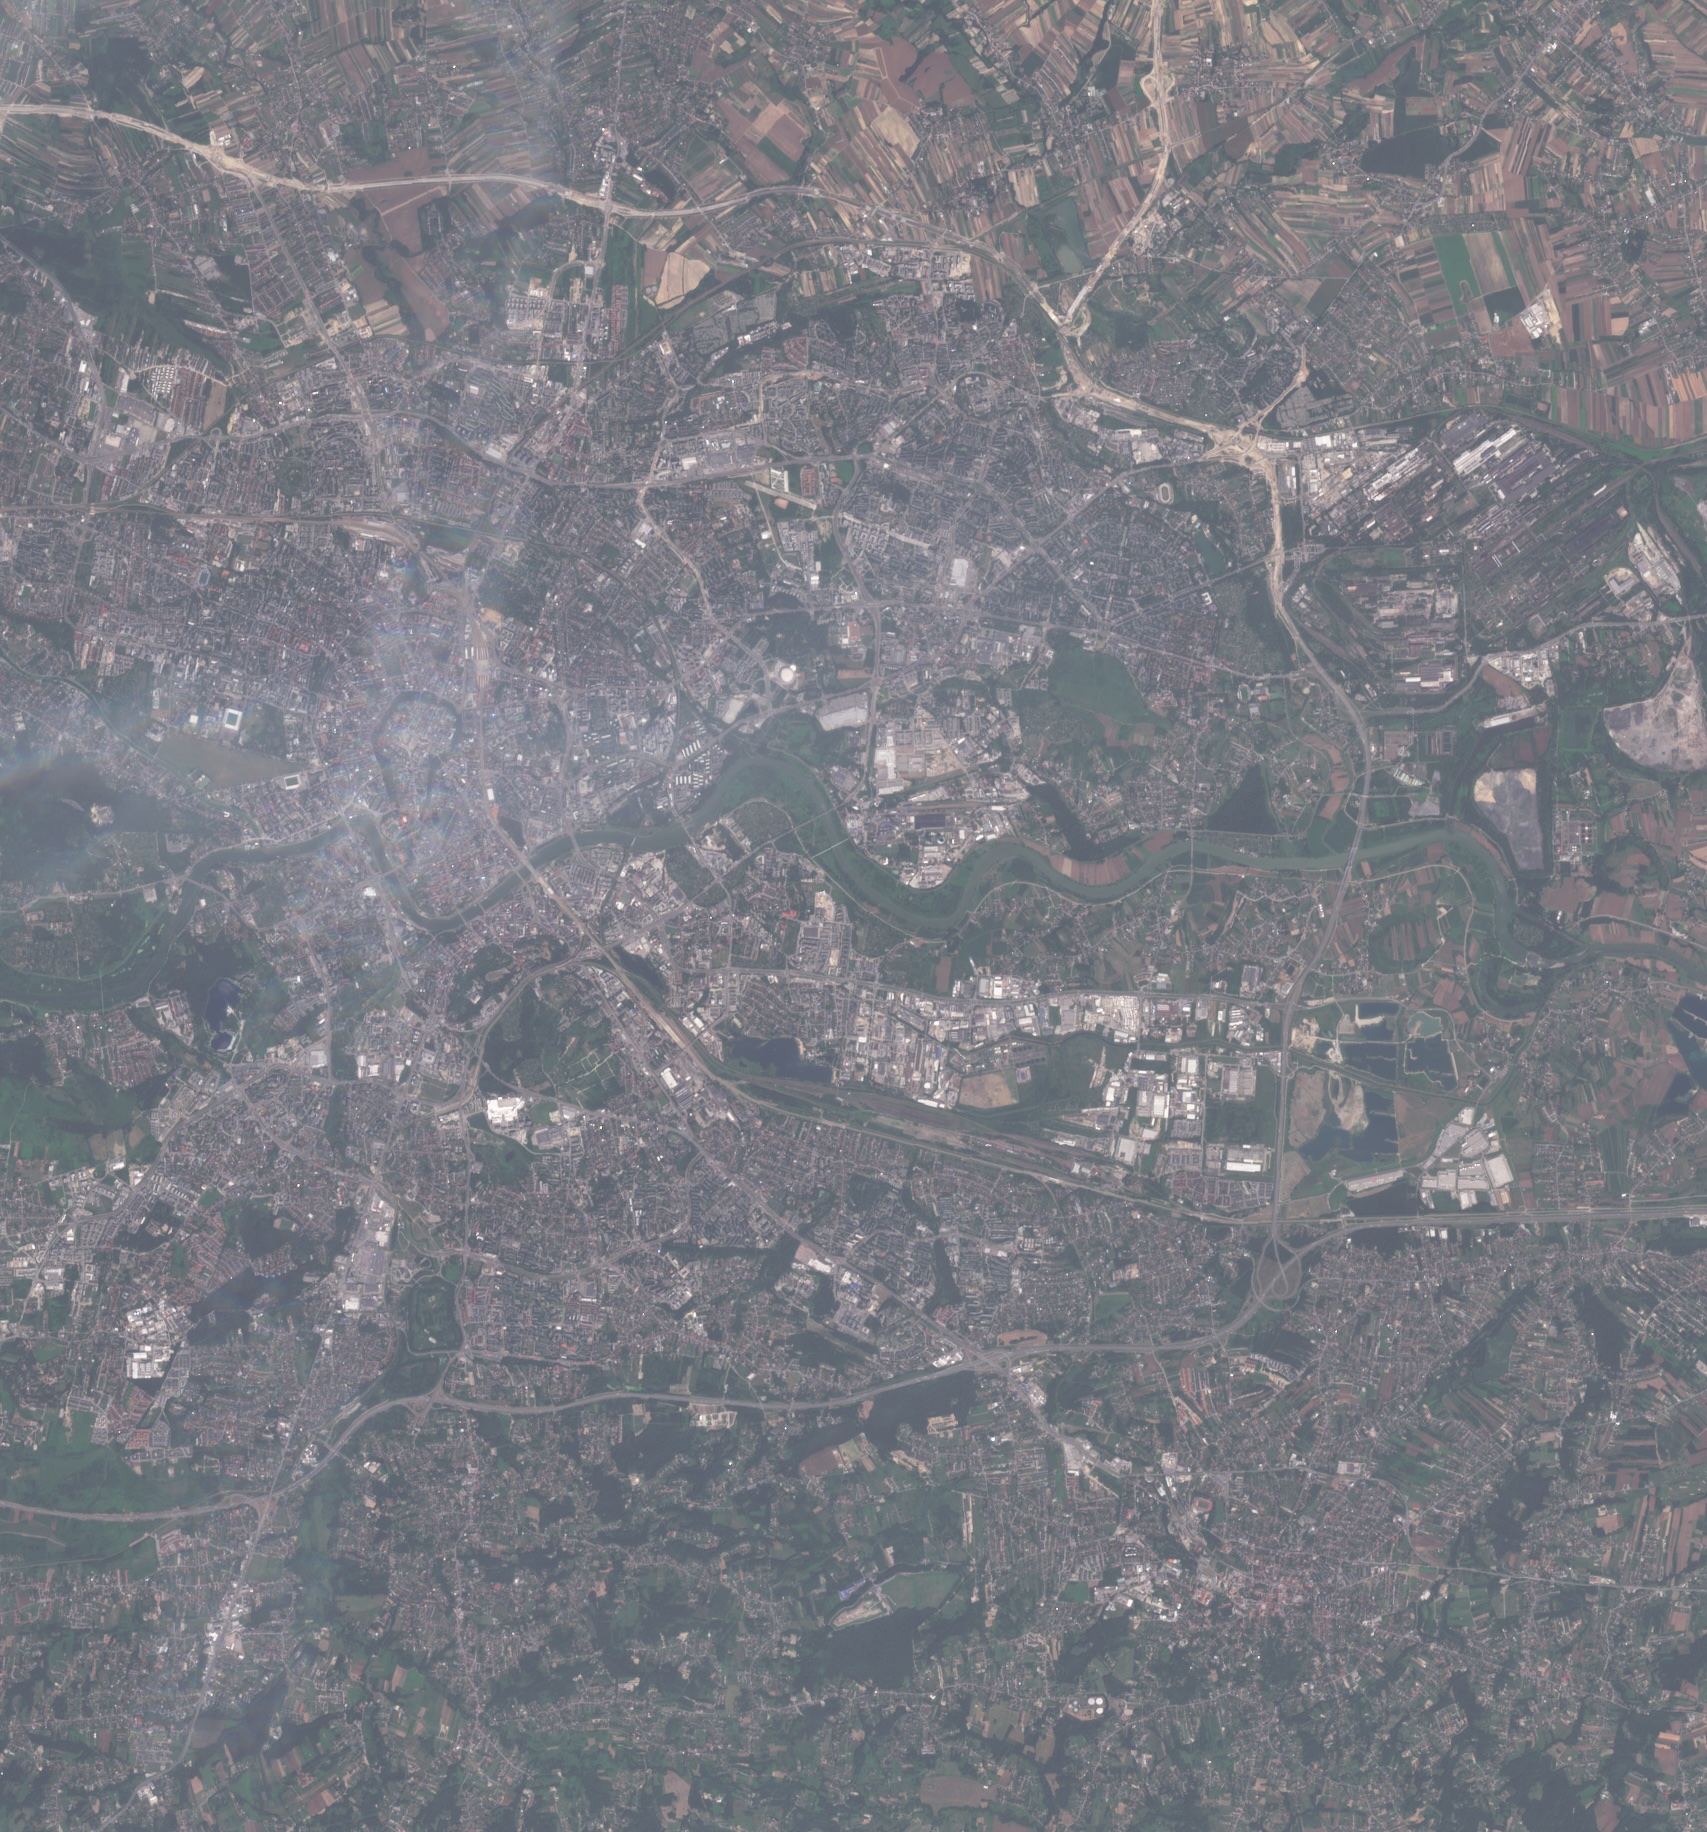
Integrating air and soil quality indices pinpoints contamination sources near sites. Early identification of pollution risks supports remediation planning and compliance with health regulations.
Automated reports align hazard assessments with local and federal environmental standards. This streamlines permit submissions and minimizes legal liability through thorough risk documentation.
Aggregate risk dashboards display hazard metrics across multiple properties for investors and insurers. Comparative analytics highlight high-risk assets and prioritize proactive interventions.
Real-time monitoring flags new environmental events like flood forecasts or wildfire ignitions. Users receive instant notifications, which ensures timely property protection decisions.
Have a different question and can’t find the answer you’re looking for? Reach out to our support team by sending us an email and we’ll get back to you as soon as we can.
Geospatial AI Platform
AI & foundation models
Deep-learning and foundation models turn raw imagery into ready-to-use insights, so you ship answers instead of training pipelines.
Conversational workflow
Ask questions in plain language and the platform responds with charts, visualizations, and next step suggestions.
GPU-accelerated cloud
Cloud-native architecture spins up on-demand GPU clusters that scale from a single scene to global archives—no manual ops, no bottlenecks.
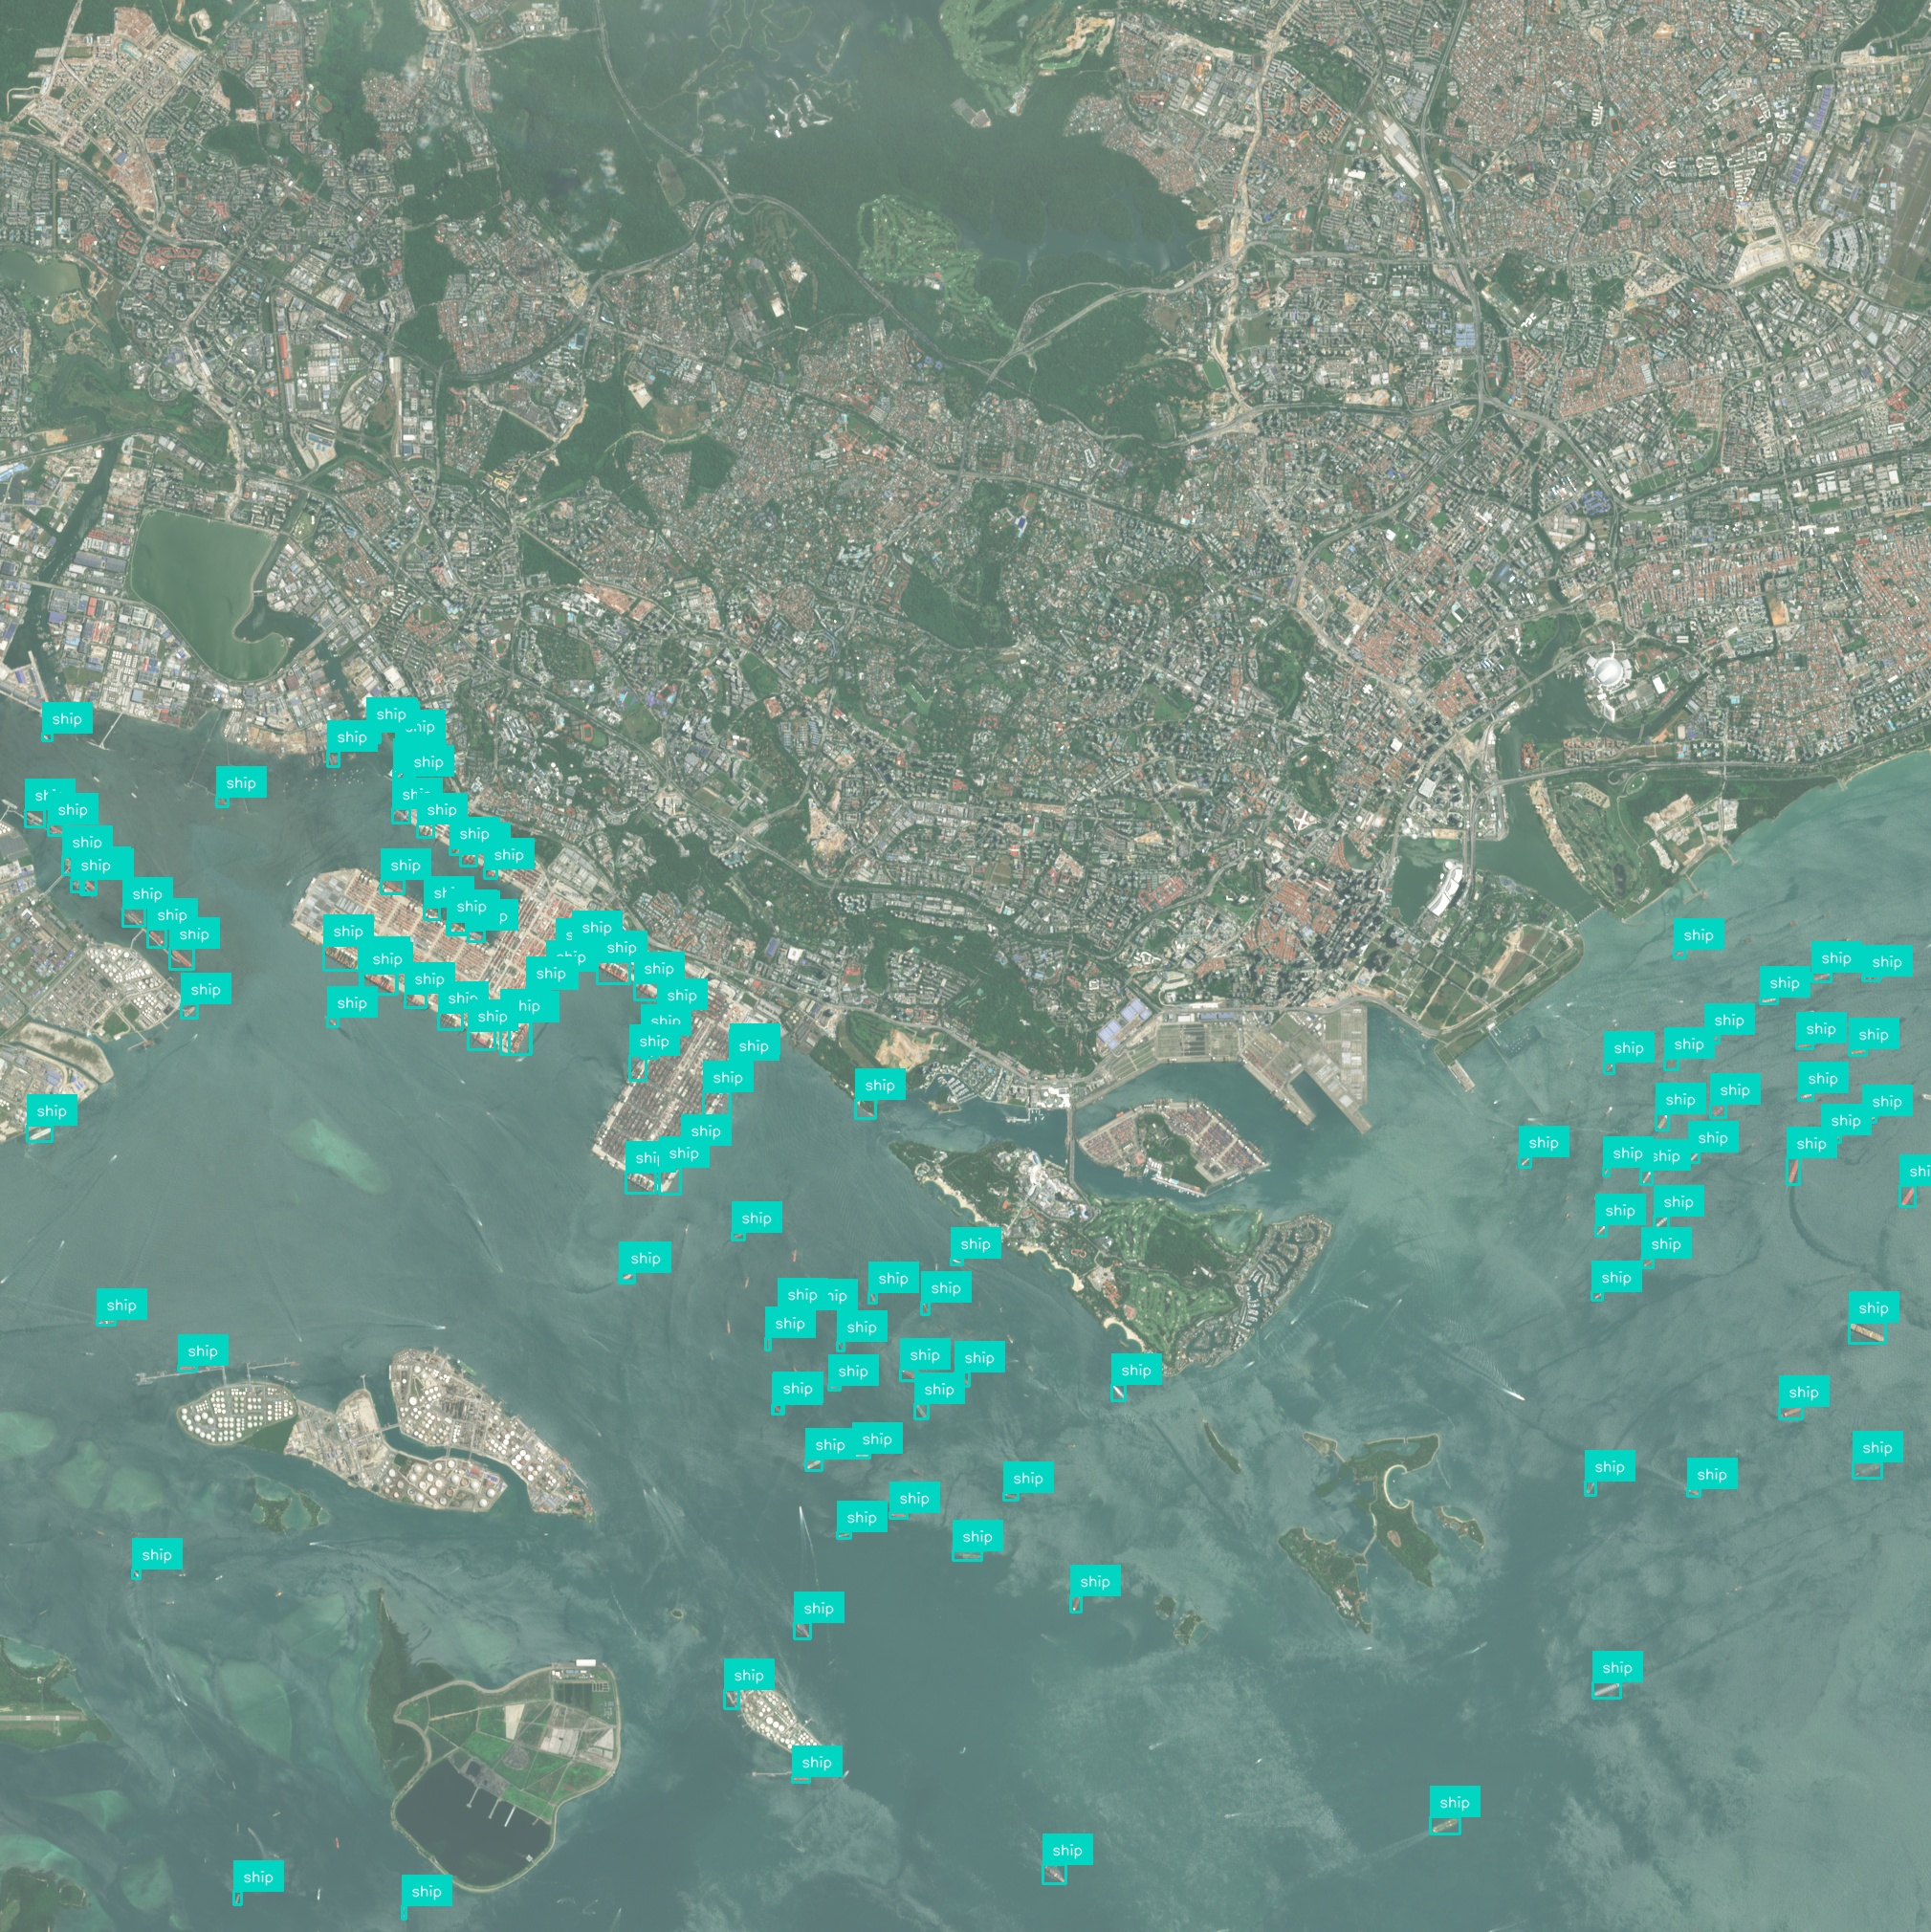
Any sensor, any format
Optical, SAR, drone, IoT, vector or raster—ingest, fuse, and analyze without conversion headaches.
Insight you can see
Real-time 2D / 3D maps and export-ready plots make results clear for engineers, execs, and clients alike.
Turn satellite, drone, and sensor data into clear, real-time insights using powerful AI – no complex setup, just answers you can see and act on.