Canopy Carbon Map
High-resolution LiDAR and multispectral analysis quantifies carbon stocks in dense forest canopies, ensuring transparent verification for nature-based carbon credit projects.
High-resolution LiDAR and multispectral analysis quantifies carbon stocks in dense forest canopies, ensuring transparent verification for nature-based carbon credit projects.
How does it work?
Measuring carbon storage in dense forest canopies is challenging with traditional ground-based surveys and satellite indices alone. Combining LiDAR and multispectral analytics provides precise, scalable verification that meets stringent carbon credit standards.
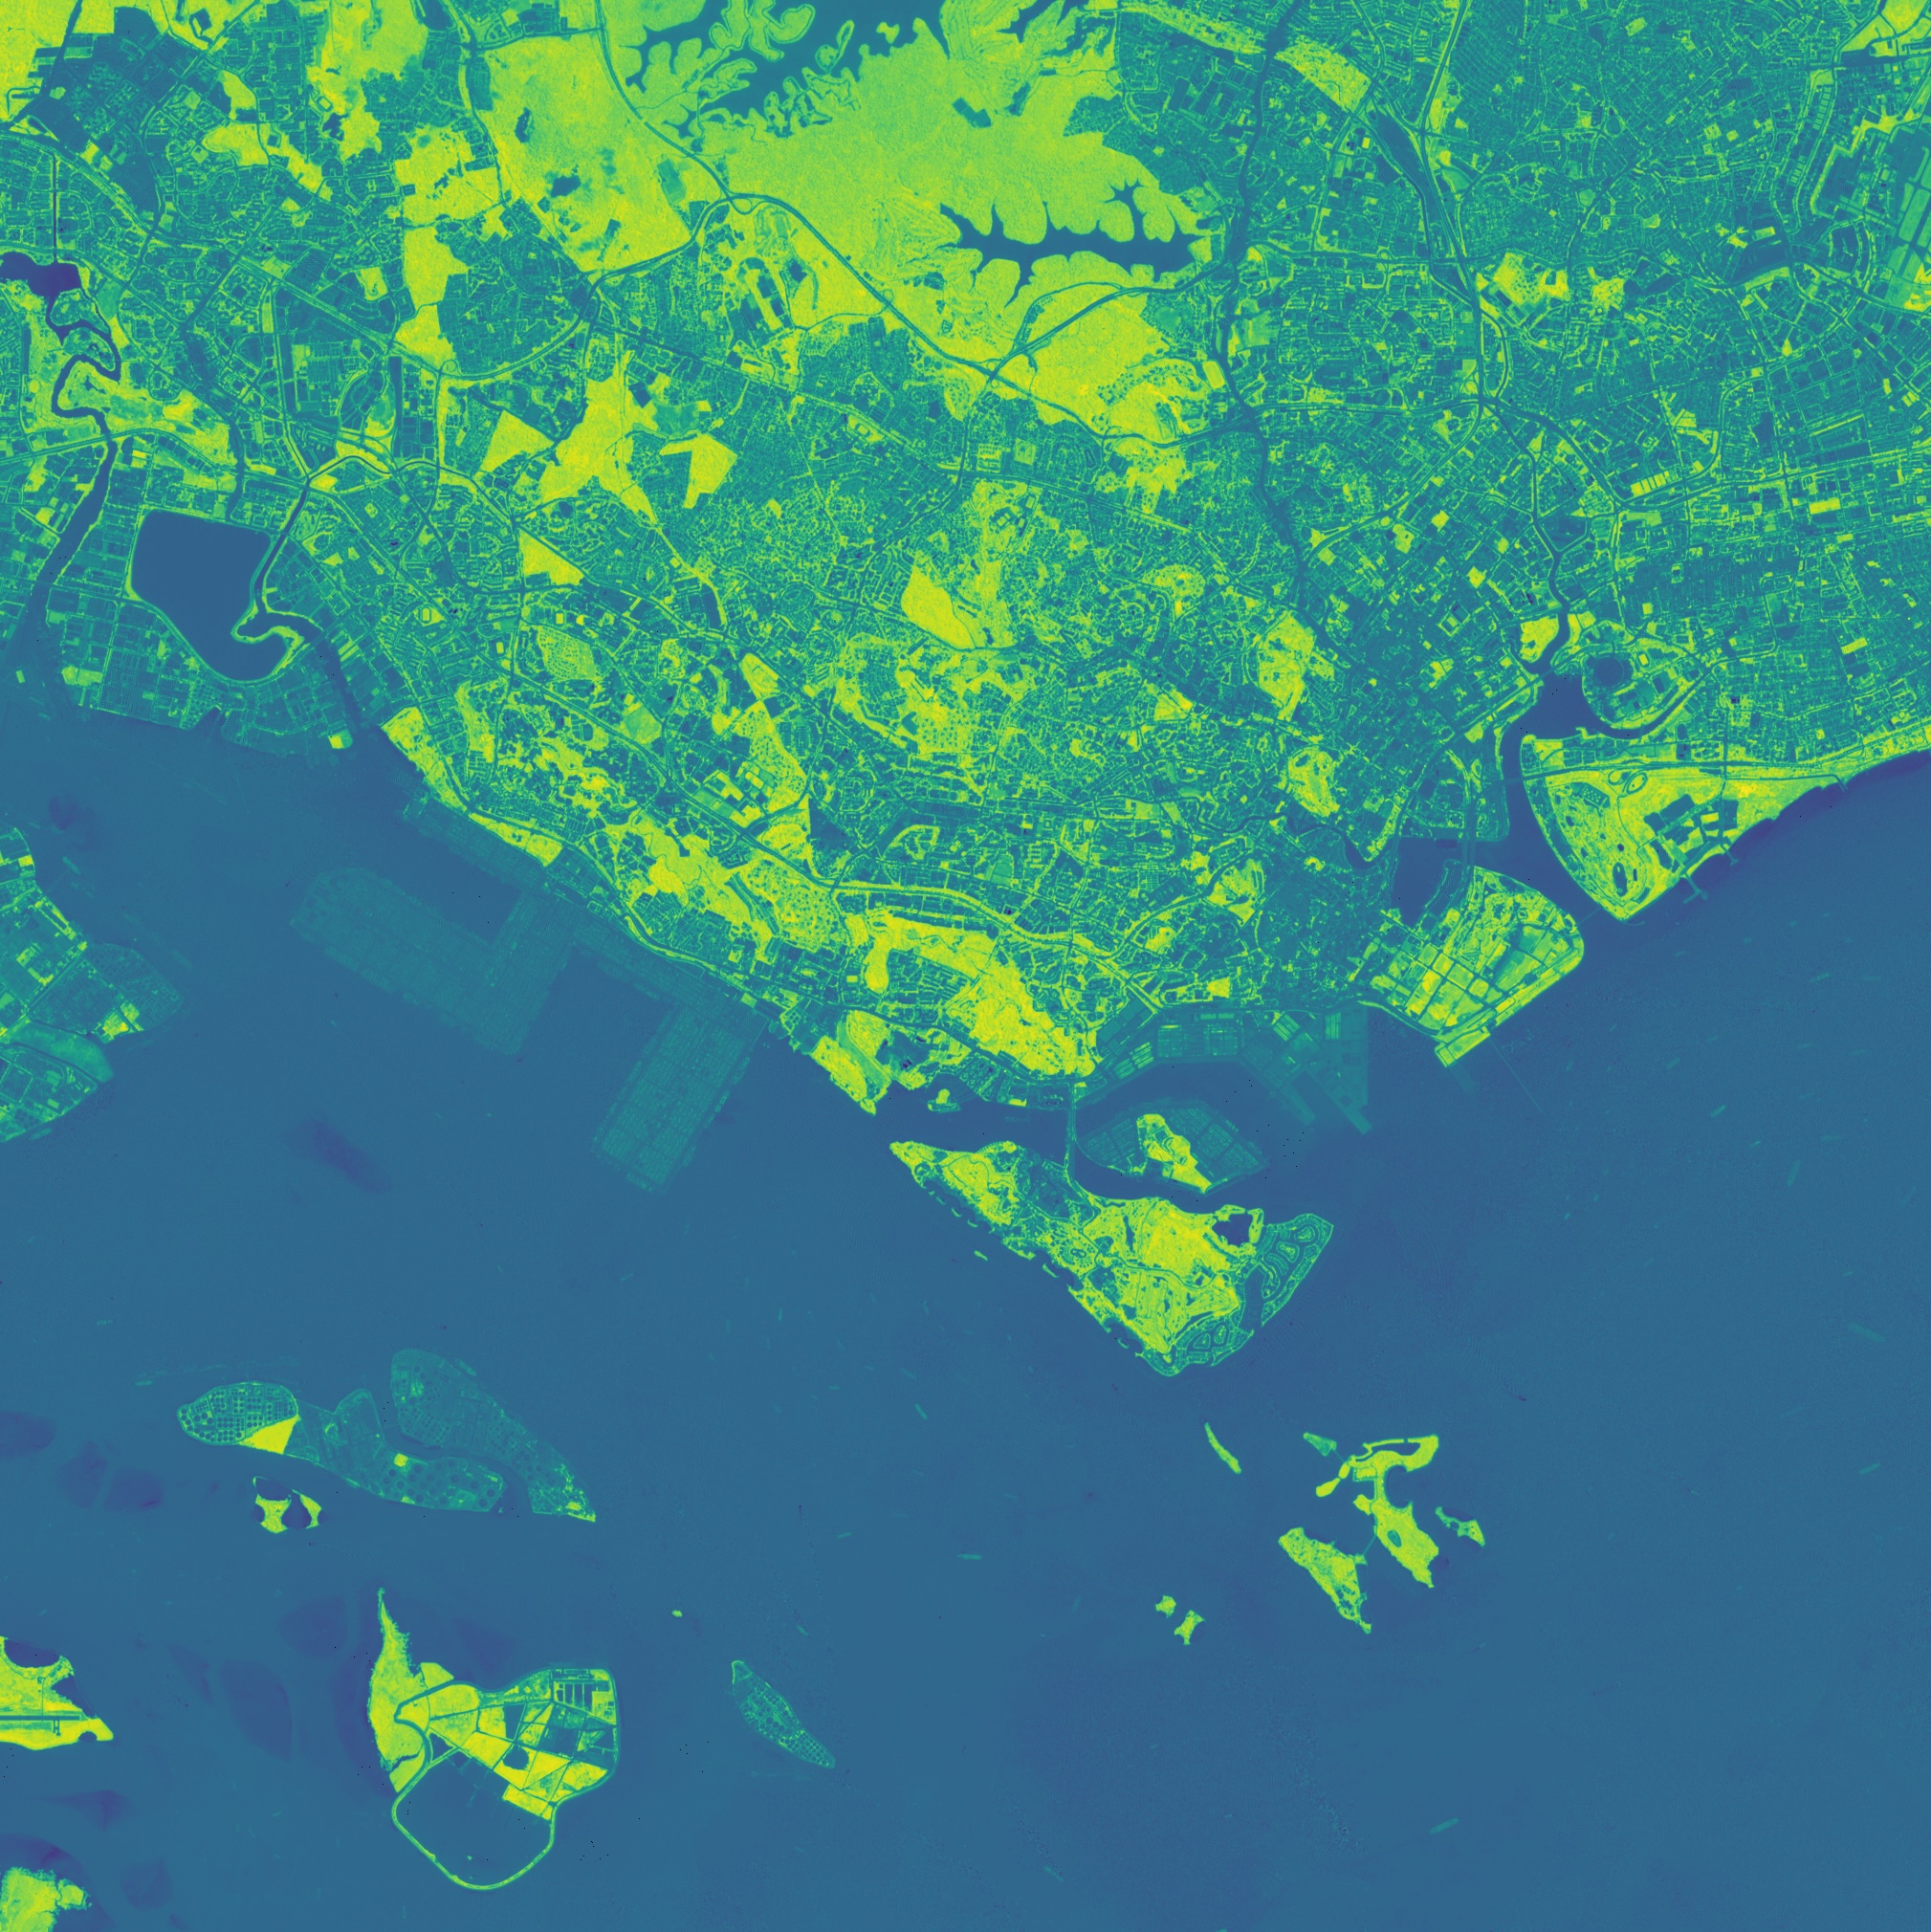
Our platform uses airborne or drone LiDAR to capture detailed forest structure at sub-meter resolution. This reveals canopy complexity and biomass distribution that satellite imagery cannot resolve.
Advanced algorithms convert 3D canopy metrics into precise carbon stock estimates. Validation against field plots ensures errors are below 5% at project scale.
Automated processing logs every data source and analysis step for full traceability. This audit-ready record simplifies third-party verification and compliance.
Cloud-based analytics handle thousands of hectares in parallel, reducing processing time from weeks to days. This scalability accelerates credit issuance cycles.
Preformatted reports align with VCS, Verra, and other carbon standards. Custom dashboards visualize carbon metrics, change over time, and confidence intervals.
APIs connect seamlessly with GIS, MRV, and credit management systems. This integration streamlines data import, analysis, and downstream reporting.
Have a different question and can’t find the answer you’re looking for? Reach out to our support team by sending us an email and we’ll get back to you as soon as we can.
Geospatial AI Platform
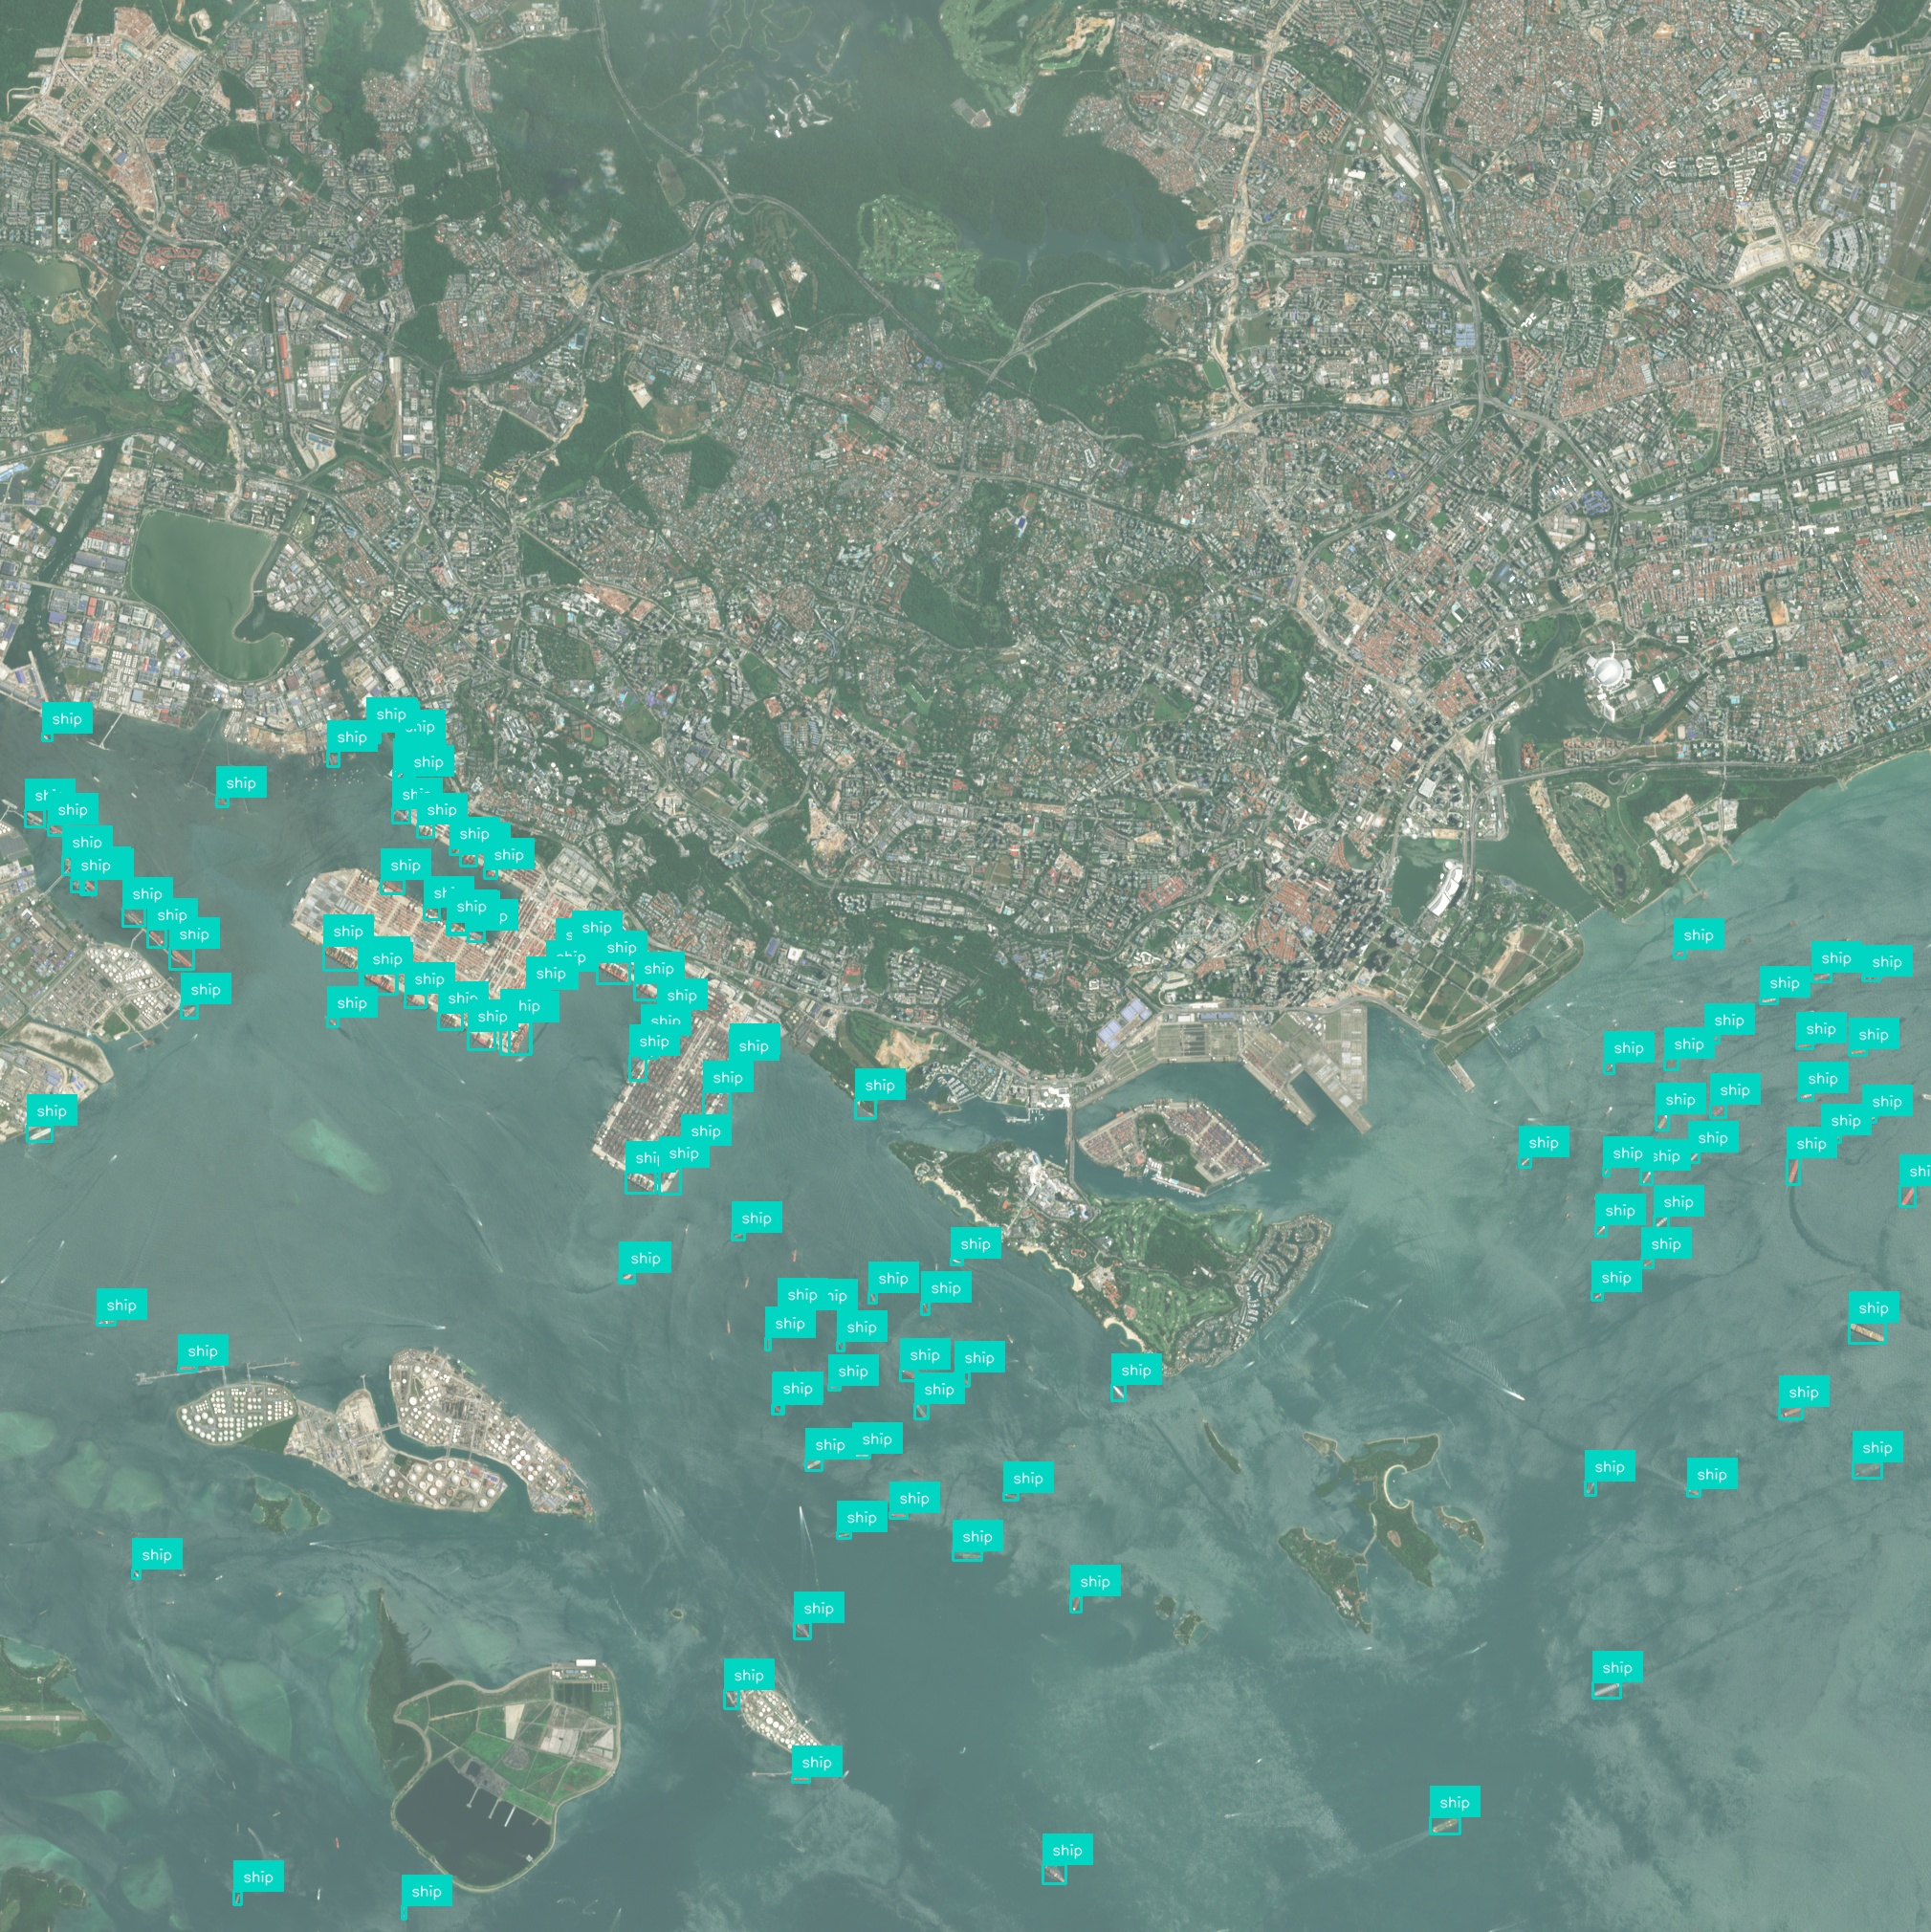
AI & foundation models
Deep-learning and foundation models turn raw imagery into ready-to-use insights, so you ship answers instead of training pipelines.
Conversational workflow
Ask questions in plain language and the platform responds with charts, visualizations, and next step suggestions.
GPU-accelerated cloud
Cloud-native architecture spins up on-demand GPU clusters that scale from a single scene to global archives—no manual ops, no bottlenecks.
Any sensor, any format
Optical, SAR, drone, IoT, vector or raster—ingest, fuse, and analyze without conversion headaches.
Insight you can see
Real-time 2D / 3D maps and export-ready plots make results clear for engineers, execs, and clients alike.
Turn satellite, drone, and sensor data into clear, real-time insights using powerful AI – no complex setup, just answers you can see and act on.