Early Stress Map
Detect crop stress up to ten days before NDVI decline using thermal and multispectral analytics, enabling proactive interventions for yield protection.
Detect crop stress up to ten days before NDVI decline using thermal and multispectral analytics, enabling proactive interventions for yield protection.
How does it work?
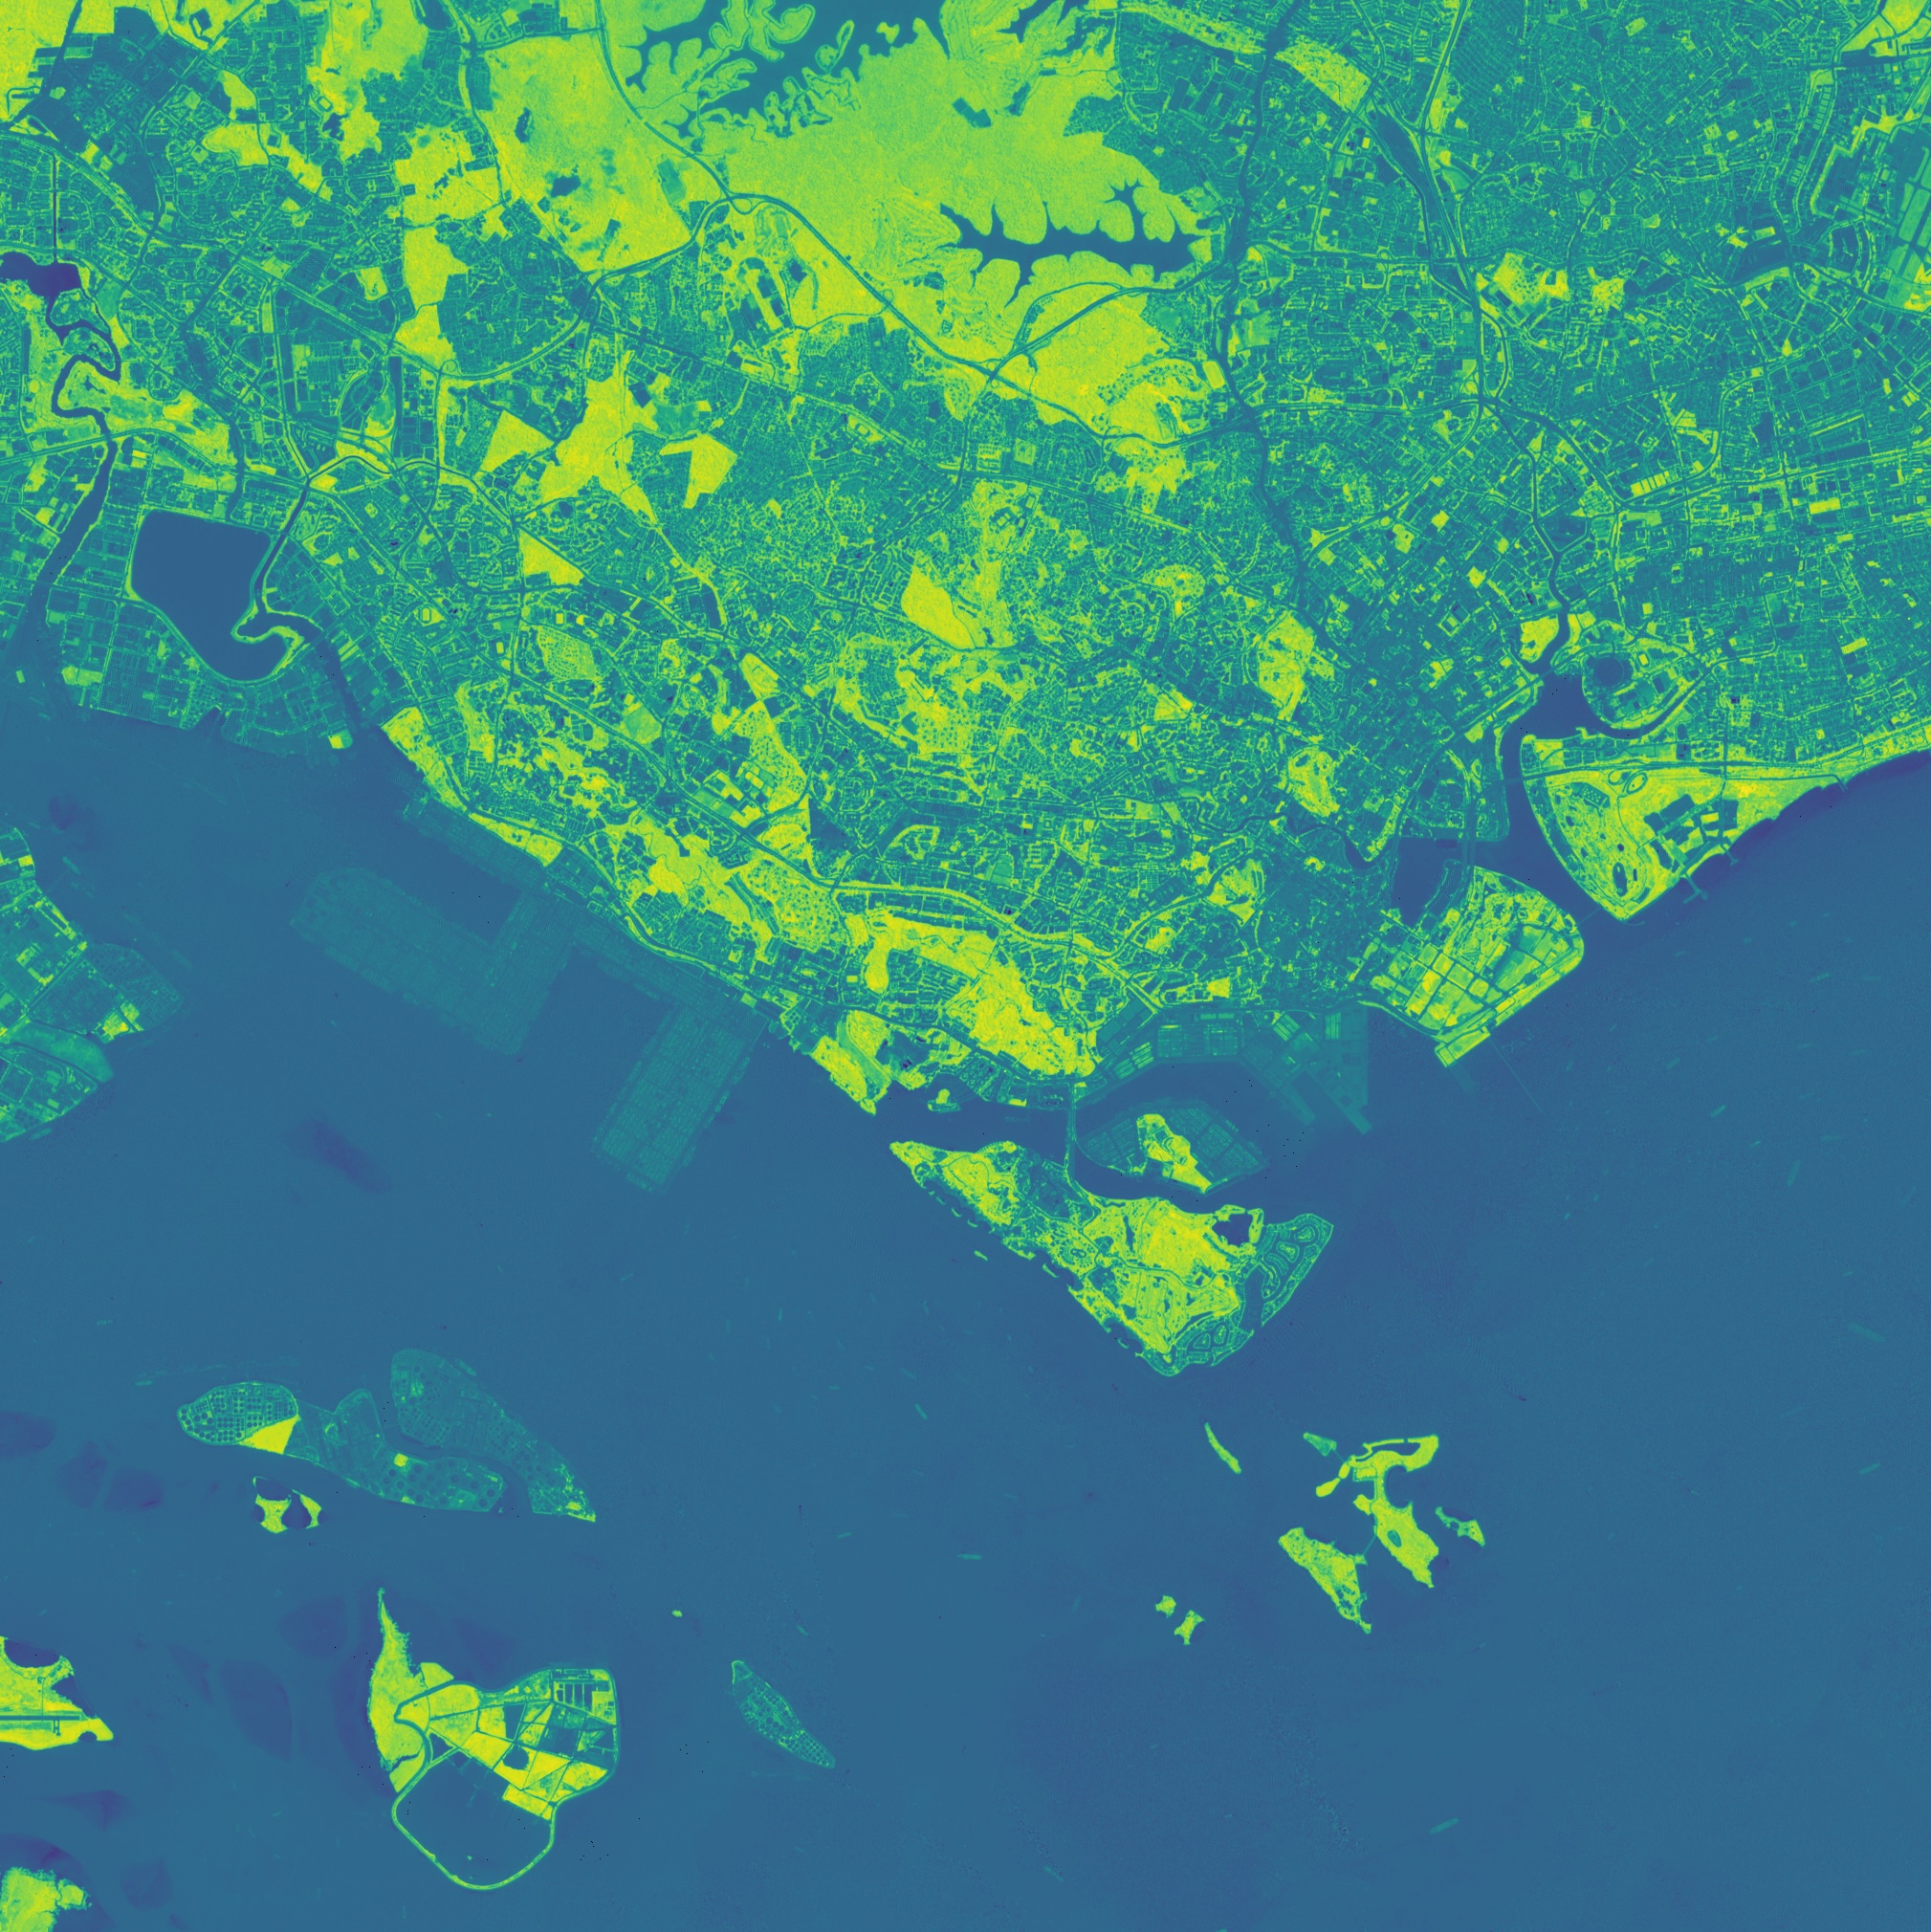
Traditional NDVI monitoring detects crop stress only after visible canopy changes, delaying interventions and increasing yield loss risk. Precursor mapping leverages thermal anomalies and early spectral shifts to identify stress signals up to ten days sooner, enabling timely management actions.
Identifies thermal or spectral stress indicators up to ten days before NDVI decline. This lead time allows agronomists to respond before visible symptoms appear.
Provides actionable insights for targeted interventions such as irrigation or fertilization. This reduces crop damage and optimizes input use.
By addressing stress early, farmers can maintain optimal growth conditions and avoid yield penalties. Studies show potential yield increases of 5–10% with early interventions.
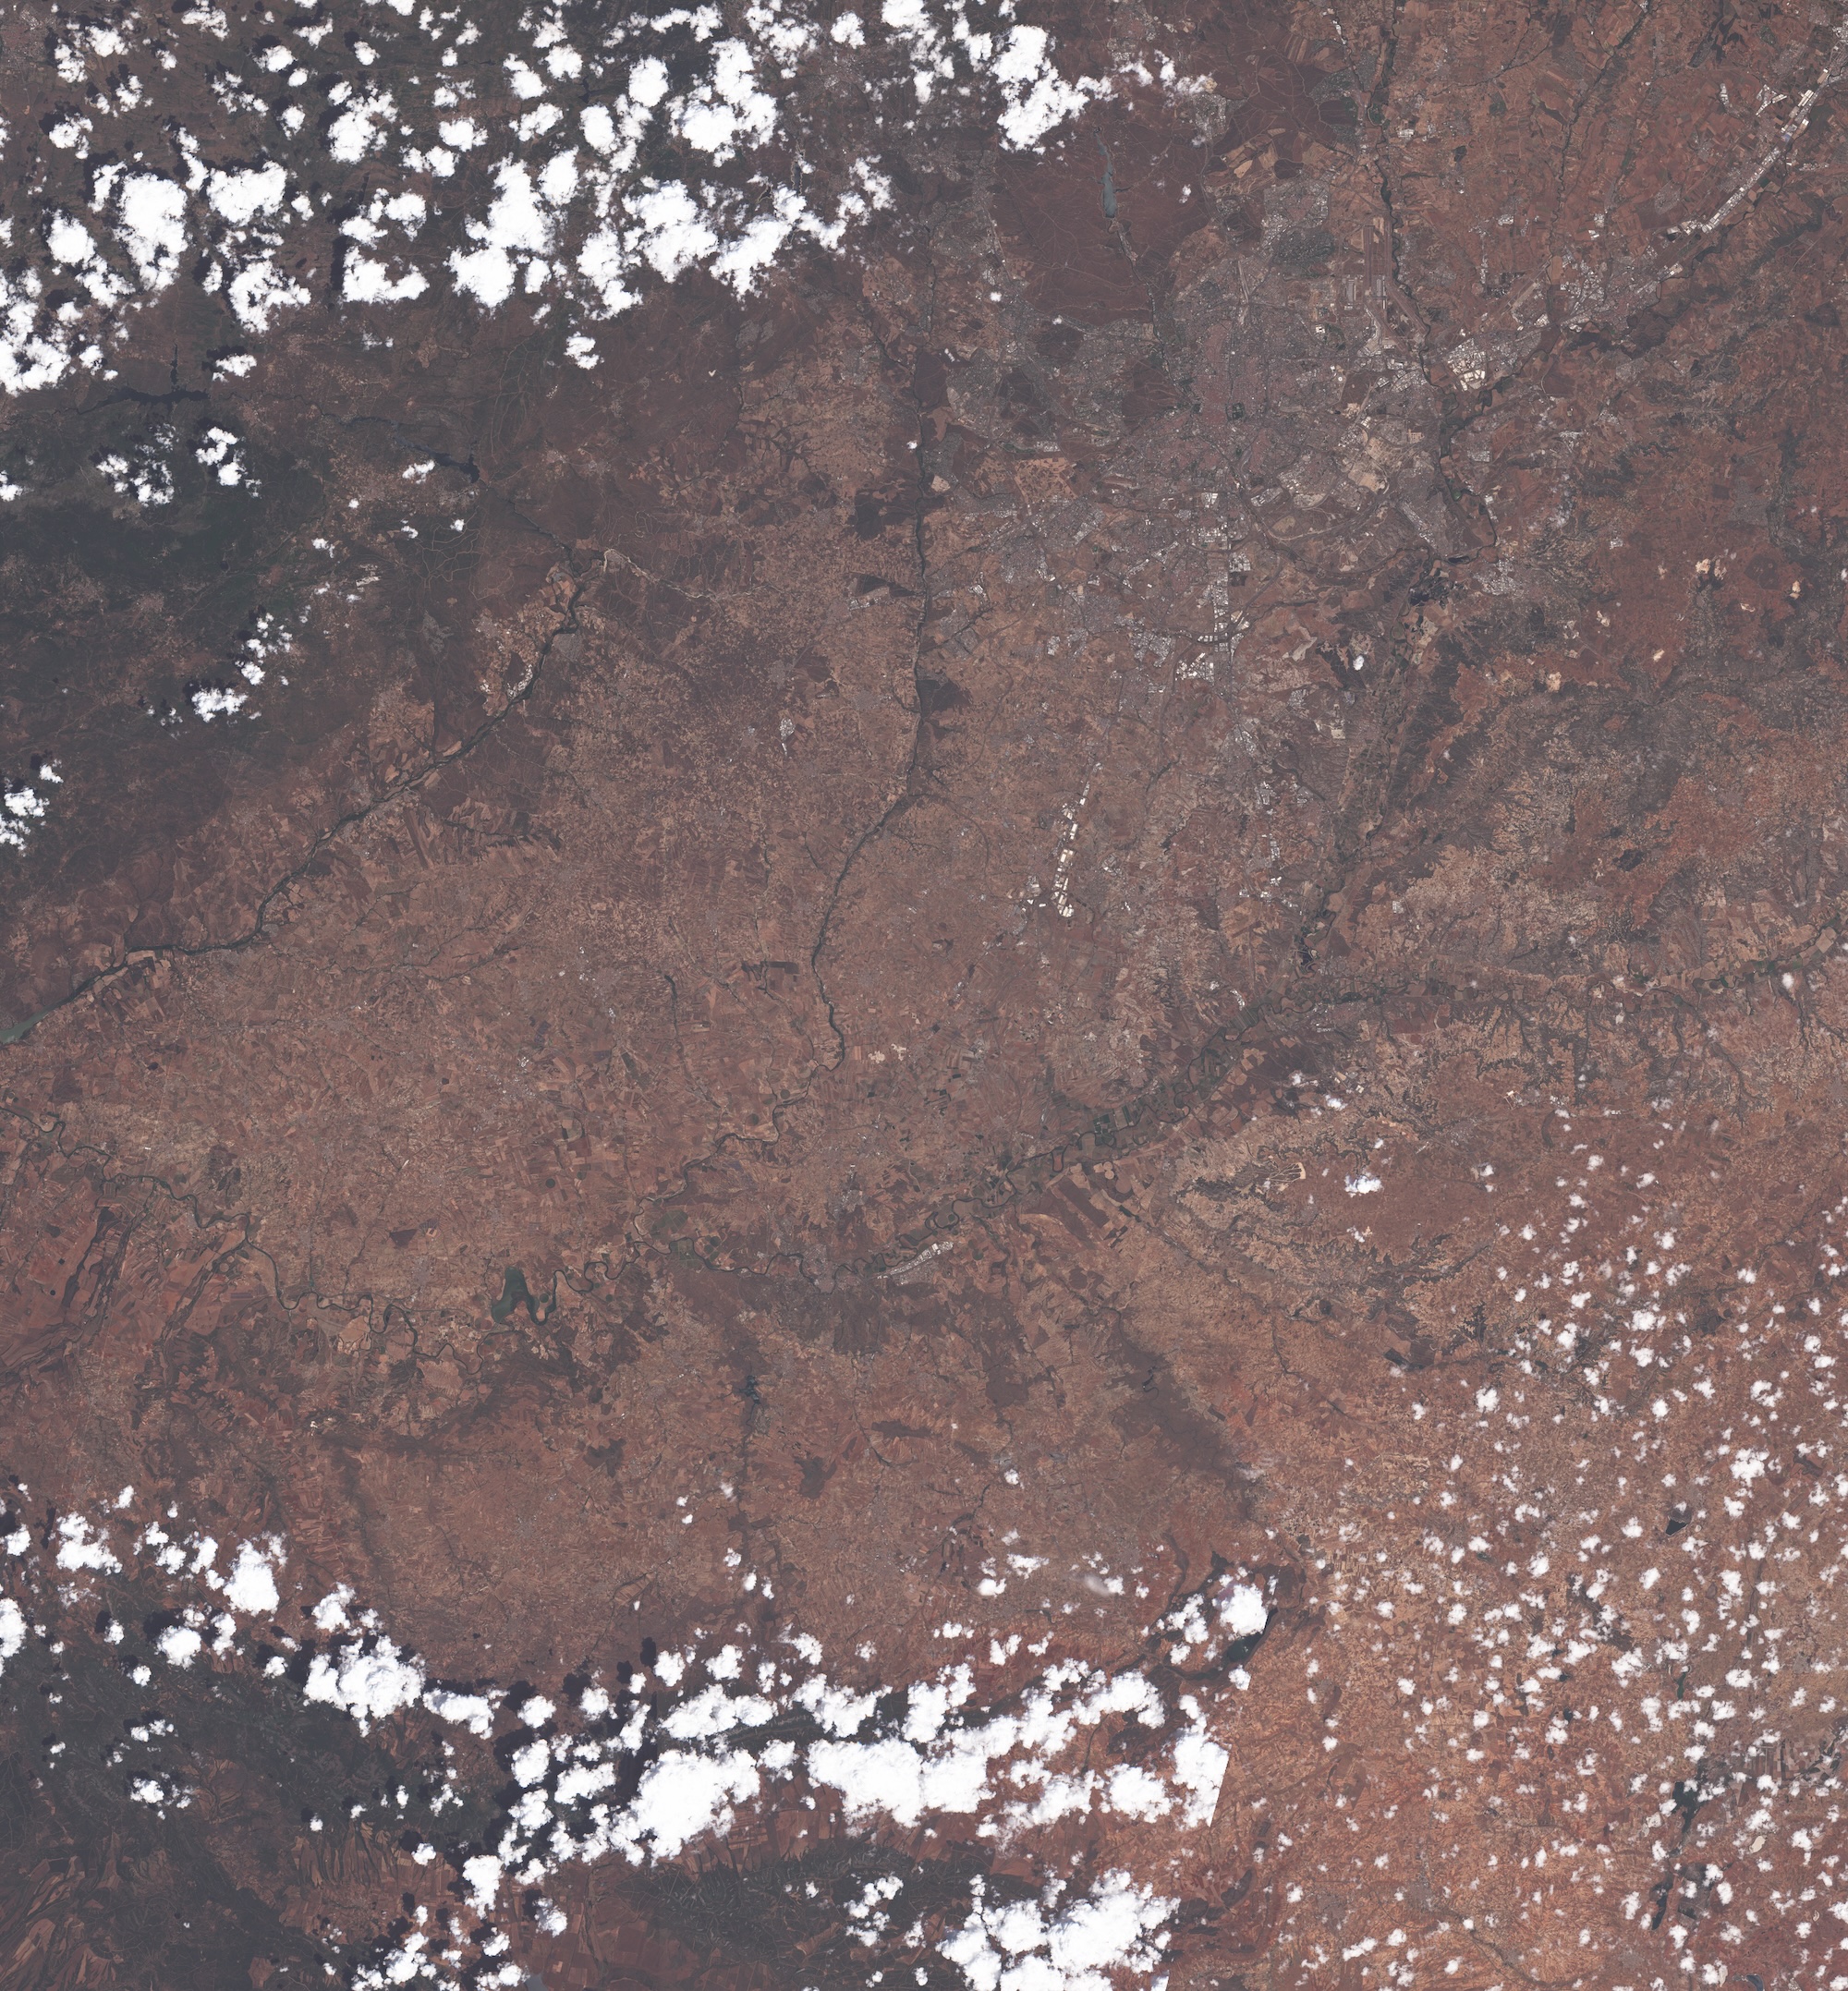
Maps crop water stress through thermal imaging, pinpointing areas requiring irrigation. This supports precise water allocation and conserves resources.
Detects subtle stress patterns associated with disease or pest pressure before outbreaks. Early warnings facilitate targeted scouting and treatment, minimizing spread.
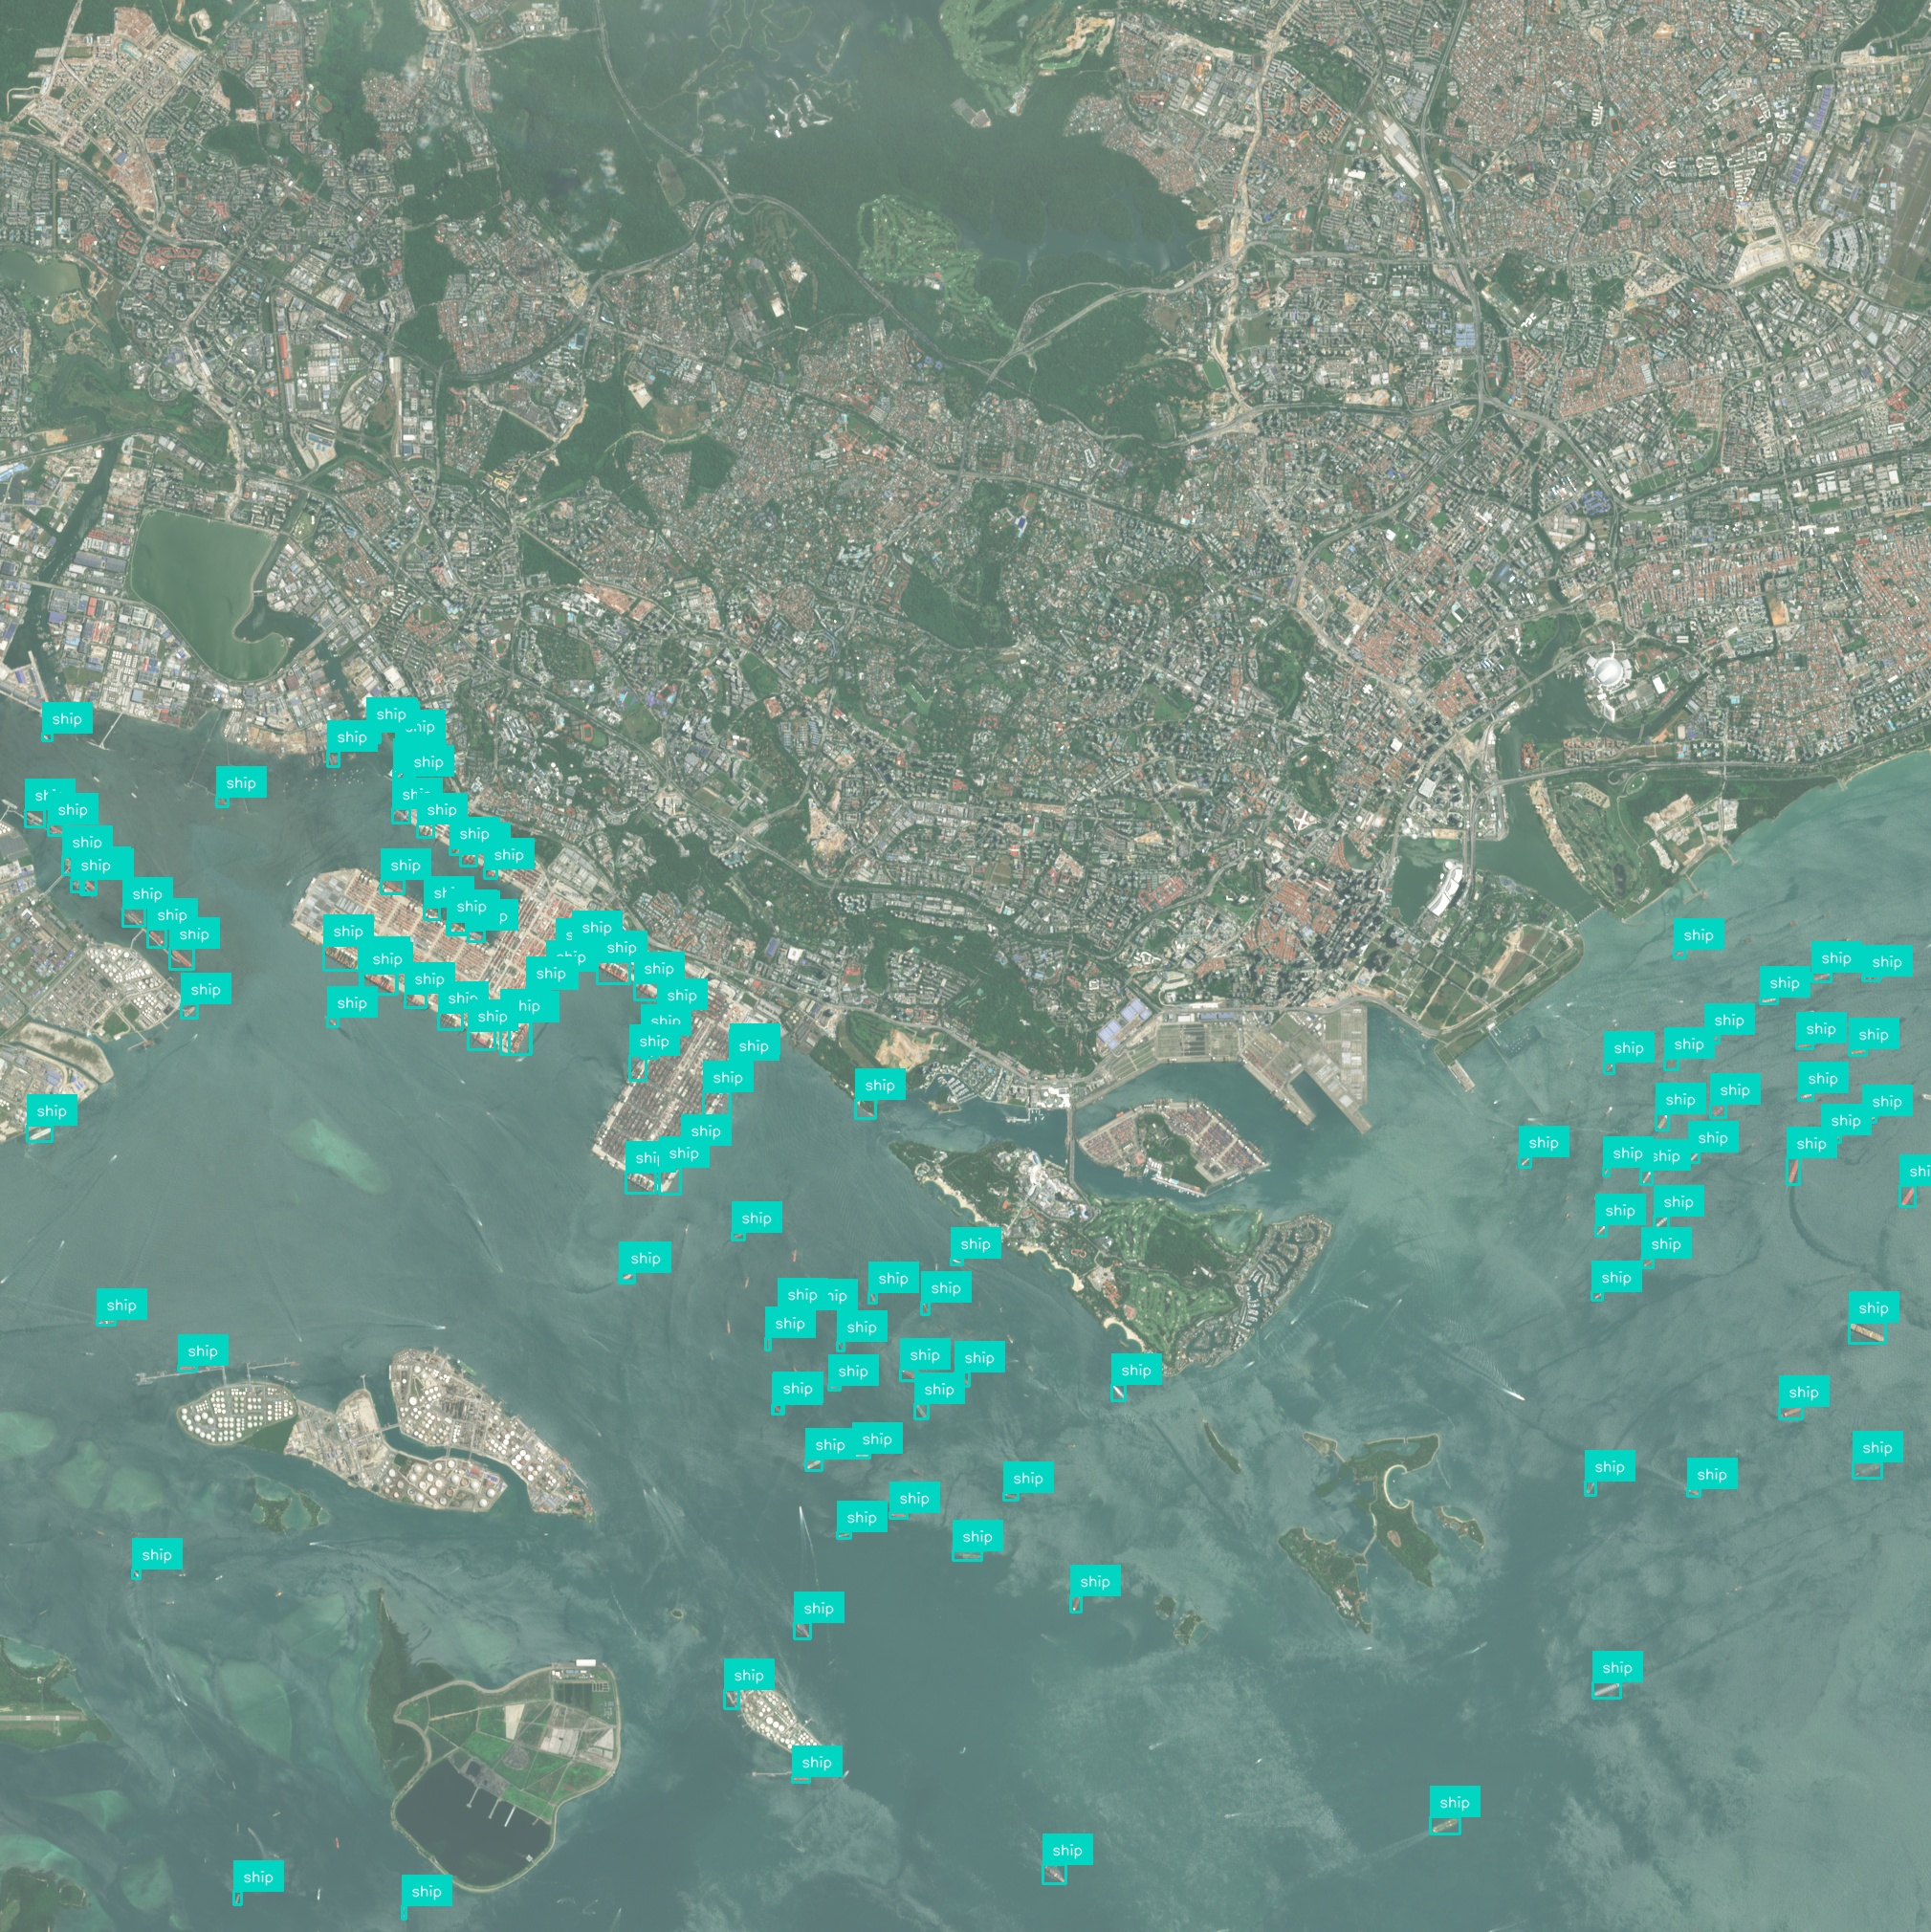
Processes satellite and drone data across thousands of hectares for regional monitoring. Seamless API integration connects to farm management systems for automated workflows.
Have a different question and can’t find the answer you’re looking for? Reach out to our support team by sending us an email and we’ll get back to you as soon as we can.
Geospatial AI Platform
AI & foundation models
Deep-learning and foundation models turn raw imagery into ready-to-use insights, so you ship answers instead of training pipelines.
Conversational workflow
Ask questions in plain language and the platform responds with charts, visualizations, and next step suggestions.
GPU-accelerated cloud
Cloud-native architecture spins up on-demand GPU clusters that scale from a single scene to global archives—no manual ops, no bottlenecks.
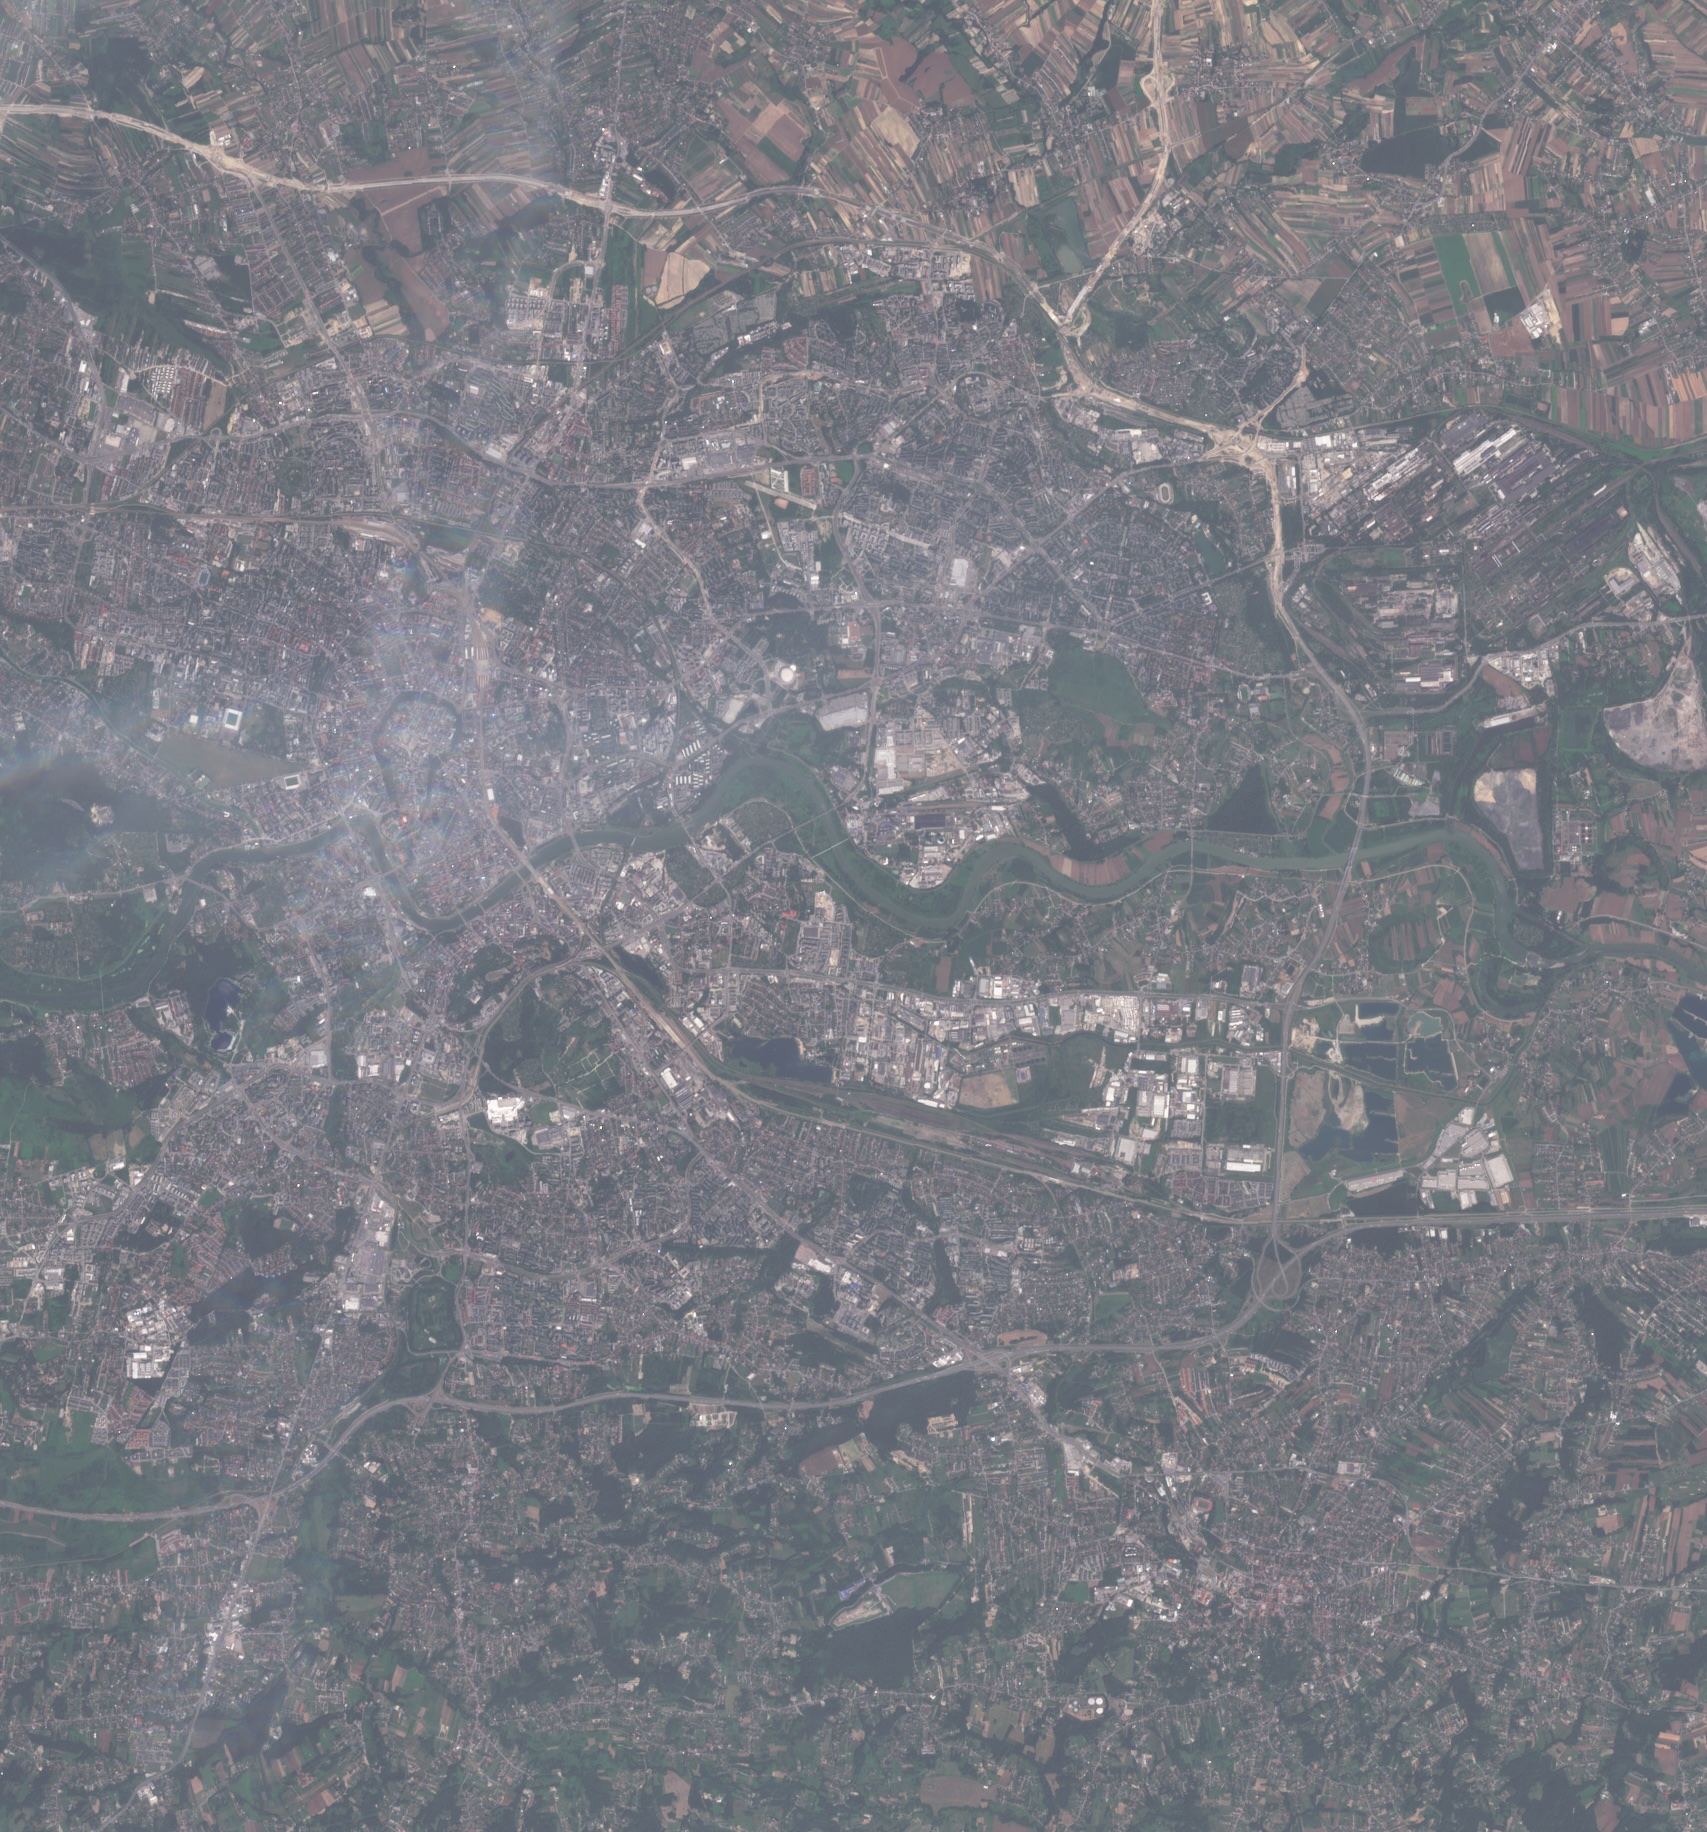
Any sensor, any format
Optical, SAR, drone, IoT, vector or raster—ingest, fuse, and analyze without conversion headaches.
Insight you can see
Real-time 2D / 3D maps and export-ready plots make results clear for engineers, execs, and clients alike.
Turn satellite, drone, and sensor data into clear, real-time insights using powerful AI – no complex setup, just answers you can see and act on.