Urban Carbon Watch
Real-time satellite and sensor data visualize and quantify CO₂ emissions across urban districts, ensuring compliance with carbon regulations and reduction targets.
Real-time satellite and sensor data visualize and quantify CO₂ emissions across urban districts, ensuring compliance with carbon regulations and reduction targets.
How does it work?
Cities lack granular, continuous CO₂ monitoring, relying on infrequent manual inventories that miss localized emission spikes. Urban Carbon Watch integrates multi-source data and analytics to deliver precise, actionable insights for regulatory compliance and emissions reduction.
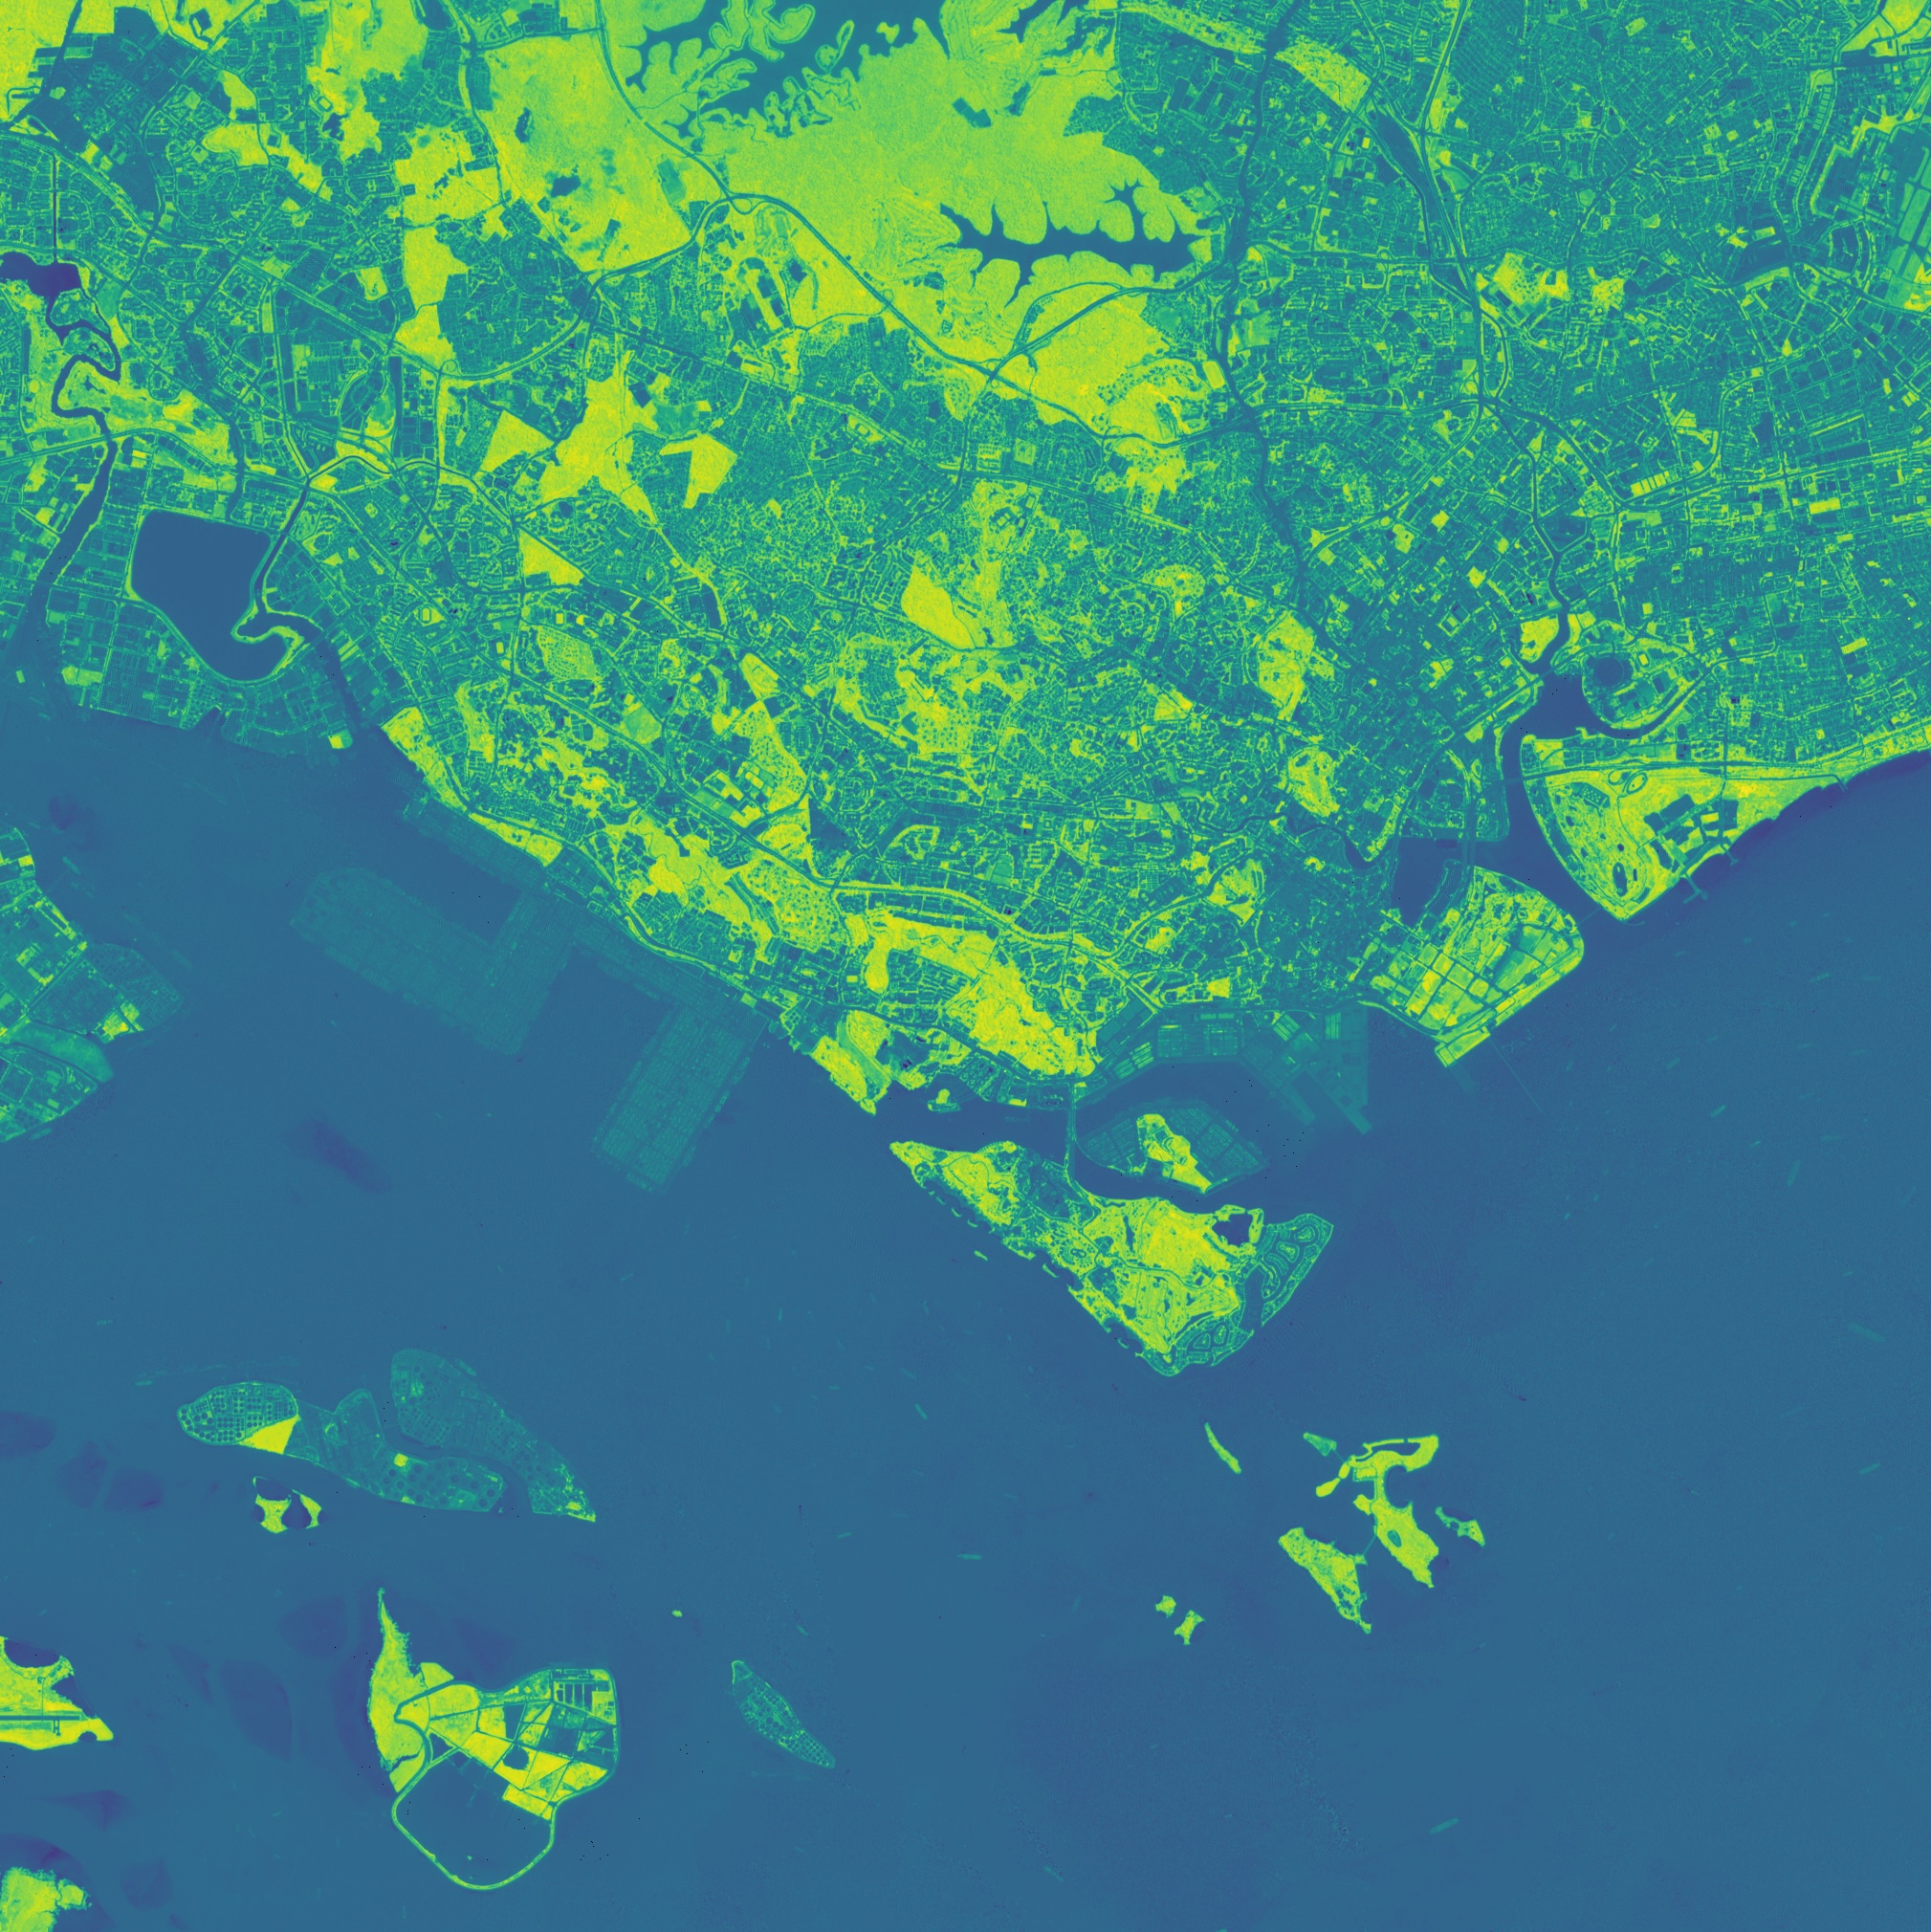
Dynamic heatmaps display CO₂ concentrations at neighborhood and block levels. This spatial granularity reveals emission hotspots and supports targeted mitigation measures.
Scheduled reports align with local and international carbon regulations, reducing manual workload. Automated data validation ensures accuracy for audits and regulatory filings.
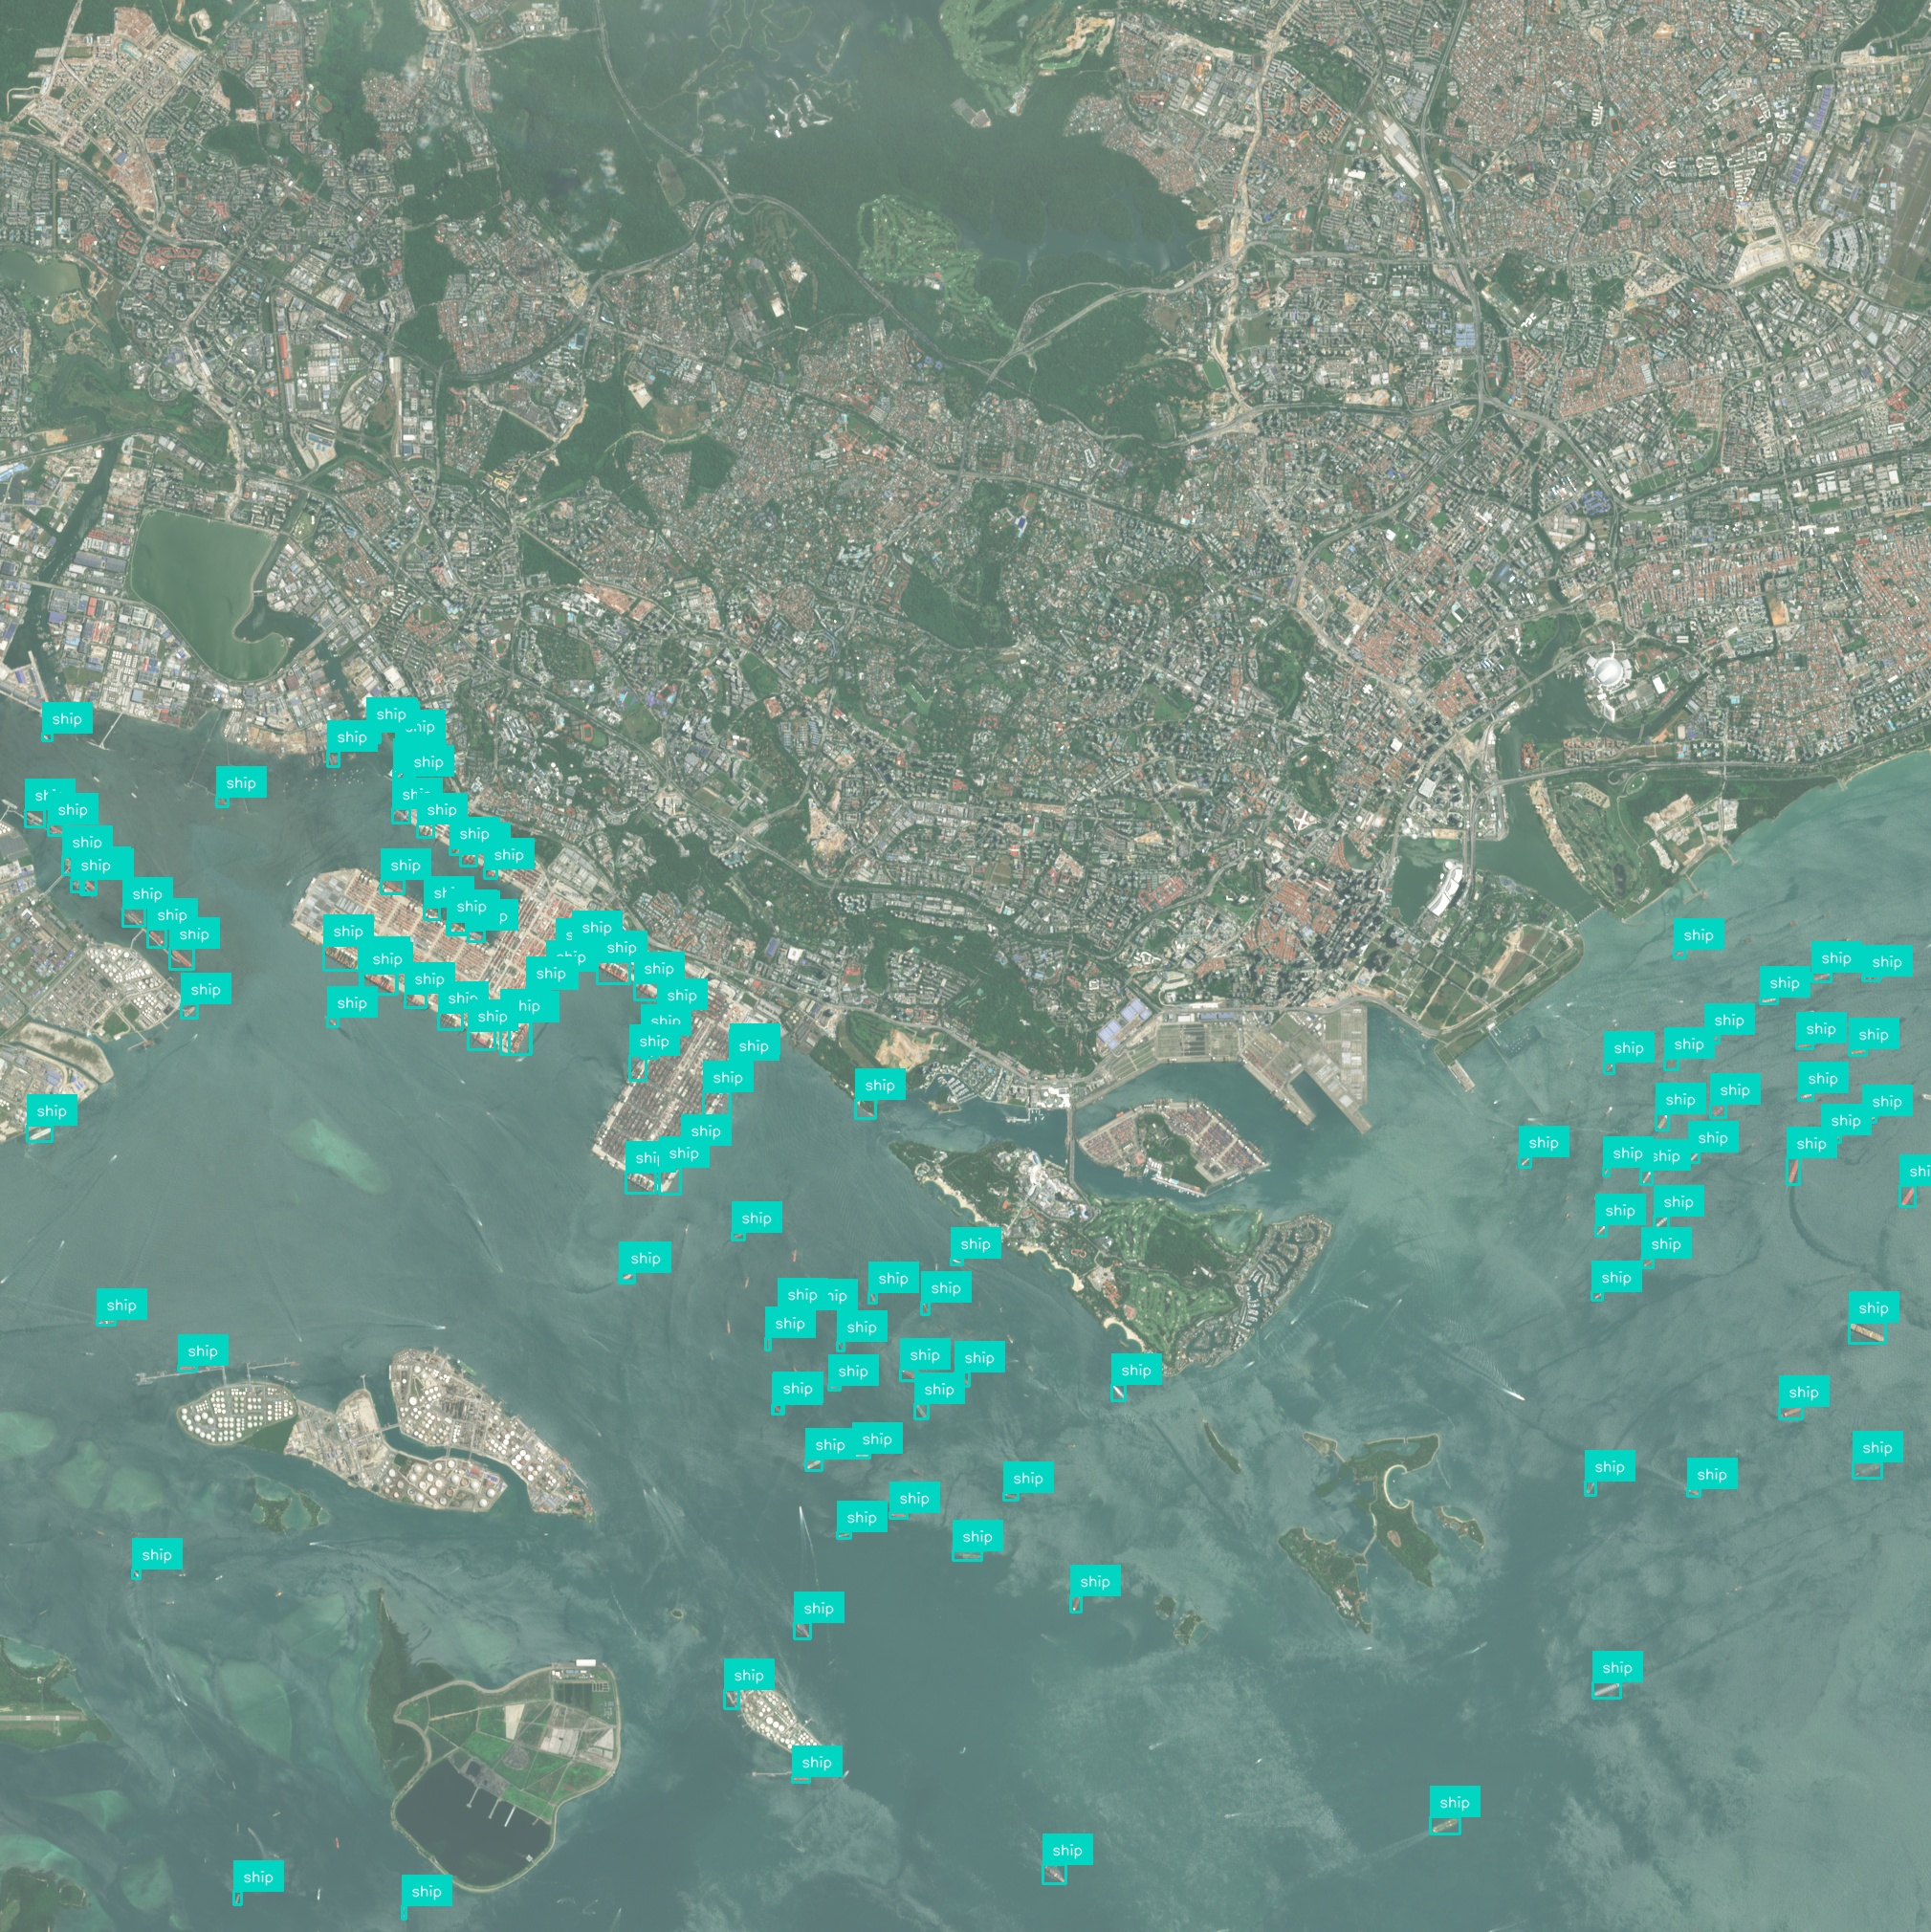
Continuous sensor and satellite feeds trigger notifications when emissions exceed thresholds. Early detection of anomalies enables prompt investigation and corrective action.
Machine learning models forecast emission trends under various policy or traffic scenarios. Scenario analysis guides city planners in evaluating the impact of interventions before implementation.
Web dashboards and public portals share up-to-date emission metrics with citizens and investors. Transparent reporting fosters community engagement and supports sustainability pledges.
Identifying high-emission zones helps prioritize infrastructure upgrades and traffic management. Focused interventions reduce operational costs and improve air quality efficiently.
Have a different question and can’t find the answer you’re looking for? Reach out to our support team by sending us an email and we’ll get back to you as soon as we can.
Geospatial AI Platform
AI & foundation models
Deep-learning and foundation models turn raw imagery into ready-to-use insights, so you ship answers instead of training pipelines.
Conversational workflow
Ask questions in plain language and the platform responds with charts, visualizations, and next step suggestions.
GPU-accelerated cloud
Cloud-native architecture spins up on-demand GPU clusters that scale from a single scene to global archives—no manual ops, no bottlenecks.
Any sensor, any format
Optical, SAR, drone, IoT, vector or raster—ingest, fuse, and analyze without conversion headaches.
Insight you can see
Real-time 2D / 3D maps and export-ready plots make results clear for engineers, execs, and clients alike.
Turn satellite, drone, and sensor data into clear, real-time insights using powerful AI – no complex setup, just answers you can see and act on.